ESPN’s Total QBR is a proprietary rating. ESPN builds it play by play from expected points, splits the credit between the quarterback and his teammates, discounts garbage time and adjusts for the defence faced, and it does not publish the formula, so no one can compute QBR from a box score. This calculator gives an estimate instead: a curve fitted to 10,554 published game QBRs against eleven numbers from a box score. It is our estimate, not ESPN’s number and not an ESPN tool.
On 3,236 games from 2020 to 2025 that it had never seen, the estimate missed the published QBR by 11.1 points on average; 53.7% of those games landed within 10 points and 29.0% within 5. On whole seasons the misses shrink: 94.2% of qualified seasons came within 10 points. The tables below show where it works, where it misses, and why.
The QBR Estimator
The form opens on Joe Burrow’s 2026 regular season through week 10, the worked example below. Sack yards are entered as a positive number (a box score’s “3-21” is 3 sacks, 21 yards). It takes a single game or a season: the estimate uses rates per play, so only the mix of plays matters, not the total. For the NFL’s official formula, use the passer rating calculator; for what QBR is and how it differs, see passer rating vs. QBR.
How the Estimate Works
QBR runs from 0 to 100 with 50 as average, so the estimate uses an S-shaped (logistic) curve that cannot leave that range. With P = pass attempts + times sacked + rushing attempts:
z = −2.9763 + Σ (weight × number / P)
estimated QBR = 100 / (1 + e−z)
Every input is divided by P, which is why a game and a season with the same mix of plays get the same estimate. The weights were fitted by least squares on 2,173 regular-season games from 2022-2025, each a quarterback’s box score next to the game QBR ESPN published for it:
| Number (per play) | Weight |
|---|---|
| Passing yards | +0.1852 |
| Touchdown passes | +9.3618 |
| Interceptions | −13.4260 |
| Completions | +3.3028 |
| Sacks | −2.0409 |
| Sack yards lost | −0.4067 |
| Rushing yards | +0.6374 |
| Rushing touchdowns | +10.8995 |
| Fumbles lost | −10.1174 |
| Rushing attempts | +0.9786 |
The weights read more easily as changes to one typical game. The middle 2020-2025 game in the test set was 21 of 32 for 229 yards, 1 touchdown and 1 interception, 2 sacks for 13 yards and 3 runs for 10 yards, an estimate of 48.3. Add one play to it:
| Add one… | New estimate | Change |
|---|---|---|
| a touchdown pass (one more completion, 15 more yards, a touchdown) | 56.5 | +8.2 |
| a 10-yard completion | 49.8 | +1.5 |
| an incompletion | 46.4 | −1.9 |
| an interception | 37.8 | −10.5 |
| a 7-yard sack | 43.2 | −5.1 |
| an 8-yard scramble or run | 50.4 | +2.1 |
| a 1-yard rushing touchdown | 54.6 | +6.3 |
| a lost fumble on a sack | 36.9 | −11.5 |
An interception costs more than a touchdown pass earns, and a sack costs more than two incompletions. A quarterback’s rushing yard carries 3.4 times the weight of a passing yard in the fit; one likely reason is that a completion’s yards include the receiver’s run after the catch, which QBR only partly credits to the passer. None of these are ESPN’s weights. They are what best matches ESPN’s published numbers from box-score inputs alone.
Worked Example: Joe Burrow, 2026 Through Week 10
Joe Burrow leads the 31 qualified quarterbacks in published Total QBR through week 10 at 82.0. His line: 254 of 340 for 2,795 yards, 27 touchdowns and 6 interceptions; sacked 16 times for 105 yards; 24 runs for 85 yards and 3 touchdowns; 1 lost fumble. That is P = 340 + 16 + 24 = 380 plays.
- passing yards: 2,795 / 380 = 7.3553 × +0.1852 = +1.362
- touchdown passes: 27 / 380 = 0.0711 × +9.3618 = +0.665
- interceptions: 6 / 380 = 0.0158 × −13.4260 = −0.212
- completions: 254 / 380 = 0.6684 × +3.3028 = +2.208
- sacks: 16 / 380 = 0.0421 × −2.0409 = −0.086
- sack yards: 105 / 380 = 0.2763 × −0.4067 = −0.112
- rushing yards: 85 / 380 = 0.2237 × +0.6374 = +0.143
- rushing touchdowns: 3 / 380 = 0.0079 × +10.8995 = +0.086
- fumbles lost: 1 / 380 = 0.0026 × −10.1174 = −0.027
- rushing attempts: 24 / 380 = 0.0632 × +0.9786 = +0.062
- z = −2.9763 + the ten terms above = 1.112
- estimate = 100 / (1 + e−1.112) = 75.3
The estimate is 6.7 points below the published 82.0, a little more than the 4.5-point average miss on past seasons. It still ranks him second of 31, and on the full 2026 table below the estimate and the published order agree closely (rank correlation 0.89).
2026 Quarterbacks: Estimate vs. Published QBR Through Week 10
Every quarterback ESPN lists as qualified through week 10 (31 of them), with the published season QBR from nflverse’s ESPN QBR release and the estimate from the same season’s box-score totals (nflverse weekly player stats, weeks 1-10). None of 2026 was used to fit the estimator.
| Quarterback | Team | Box-score plays | Published QBR | Estimate | Estimate − published |
|---|---|---|---|---|---|
| Joe Burrow | CIN | 380 | 82.0 | 75.3 | −6.7 |
| Brock Purdy | SF | 318 | 81.3 | 76.4 | −4.9 |
| Dak Prescott | DAL | 431 | 78.3 | 61.2 | −17.1 |
| Josh Allen | BUF | 341 | 75.1 | 67.6 | −7.5 |
| Drake Maye | NE | 345 | 73.3 | 60.3 | −13.0 |
| Jordan Love | GB | 406 | 72.8 | 56.1 | −16.7 |
| Caleb Williams | CHI | 240 | 72.7 | 60.3 | −12.4 |
| C.J. Stroud | HOU | 360 | 72.5 | 63.2 | −9.3 |
| Trevor Lawrence | JAX | 298 | 71.6 | 68.7 | −2.9 |
| Kirk Cousins | MIN | 385 | 65.0 | 59.0 | −6.0 |
| Patrick Mahomes | KC | 335 | 63.9 | 68.5 | +4.6 |
| Matthew Stafford | LAR | 404 | 61.1 | 56.0 | −5.1 |
| Bryce Young | CAR | 379 | 60.9 | 47.4 | −13.5 |
| Jayden Daniels | WSH | 272 | 60.5 | 62.8 | +2.3 |
| Jared Goff | DET | 345 | 58.2 | 60.9 | +2.7 |
| Jalen Hurts | PHI | 190 | 58.2 | 47.2 | −11.0 |
| Tyler Shough | NO | 406 | 56.9 | 51.6 | −5.3 |
| Cam Ward | TEN | 330 | 53.3 | 49.8 | −3.5 |
| Geno Smith | NYJ | 345 | 53.2 | 48.9 | −4.3 |
| Malik Willis | MIA | 270 | 53.0 | 42.5 | −10.5 |
| Michael Penix Jr. | ATL | 278 | 51.4 | 49.8 | −1.6 |
| Kyler Murray | MIN | 198 | 49.1 | 49.8 | +0.7 |
| Bo Nix | DEN | 335 | 49.0 | 51.0 | +2.0 |
| Sam Darnold | SEA | 239 | 48.6 | 42.8 | −5.8 |
| Jacoby Brissett | BAL | 406 | 48.6 | 44.4 | −4.2 |
| Aaron Rodgers | PIT | 357 | 46.7 | 41.4 | −5.3 |
| Jameis Winston | NYG | 202 | 45.1 | 39.2 | −5.9 |
| Deshaun Watson | CLE | 385 | 40.1 | 46.0 | +5.9 |
| Baker Mayfield | TB | 177 | 32.0 | 33.9 | +1.9 |
| Daniel Jones | IND | 382 | 30.3 | 31.4 | +1.1 |
| Justin Herbert | LAC | 327 | 30.1 | 35.5 | +5.4 |
13 of the 31 estimates are within 5 points of the published figure and 24 within 10. The estimate is lower for 22 of 31, by 4.7 points on average: in 2026 the published numbers run higher than box scores alone imply. The estimate did not run this far below in any test season: on 2026 games it is 3.4 points below on average, while the lowest season in 2020-2025 was 0.7 below. Read 2026 estimates as a few points conservative.
How Accurate It Is
Every test below is out of sample, and whole seasons are held out, never a random split. Each test season is predicted by a model fitted only on the four seasons before it, the same way the shipped model (2022-2025) is used on 2026. The window of four was chosen on 2016-2019 alone (four and six seasons tied at 10.99 average miss; four had the smaller bias), before 2020-2025 was scored.
| Test | Lines | Average miss | Within 5 | Within 10 |
|---|---|---|---|---|
| Games, 2020-2025 (the estimator) | 3,236 | 11.1 | 29.0% | 53.7% |
| Games, 2020-2025: passer rating rescaled to QBR | 3,236 | 13.9 | 21.9% | 42.3% |
| Games, 2020-2025: guess the average every time | 3,236 | 21.0 | 13.3% | 25.2% |
| Qualified seasons, 2016-2025 | 308 | 4.5 | 59.4% | 94.2% |
| Games, 2026 weeks 1-10 | 301 | 11.2 | 28.2% | 54.5% |
| Qualified seasons, 2026 through week 10 | 31 | 6.4 | 41.9% | 77.4% |
“Passer rating rescaled” is the best straight line from passer rating to QBR, fitted on the same four-season windows: the estimator beats it by 2.9 points a game, mostly because it sees sacks and rushing. By season of the game test:
| Season | Games | Average miss | Within 5 | Within 10 | Average estimate − published |
|---|---|---|---|---|---|
| 2020 | 517 | 12.3 | 26% | 50% | +4.0 |
| 2021 | 546 | 10.6 | 28% | 54% | +1.3 |
| 2022 | 540 | 10.8 | 30% | 55% | −0.7 |
| 2023 | 546 | 10.9 | 29% | 54% | −0.5 |
| 2024 | 547 | 10.7 | 32% | 60% | +1.3 |
| 2025 | 540 | 11.2 | 30% | 49% | +0.4 |
Calibration
When the estimate says 70, do the published numbers average 70? The 3,236 test games, grouped by their estimate:
| Estimate band | Games | Average estimate | Average published QBR | Average miss | Within 10 |
|---|---|---|---|---|---|
| 0-20 | 185 | 13.8 | 14.1 | 6.8 | 78% |
| 20-30 | 307 | 25.2 | 24.0 | 9.6 | 56% |
| 30-40 | 355 | 35.2 | 34.7 | 11.3 | 48% |
| 40-50 | 533 | 45.1 | 44.0 | 13.3 | 41% |
| 50-60 | 571 | 55.1 | 54.4 | 13.4 | 45% |
| 60-70 | 517 | 65.0 | 64.2 | 11.8 | 49% |
| 70-80 | 403 | 74.9 | 73.7 | 10.4 | 58% |
| 80-100 | 365 | 86.6 | 84.9 | 6.9 | 80% |
Each band’s average lands within 1.7 points of the published average, so the estimate is not biased toward the middle or the ends. Single-game misses are largest in the middle bands (40-60) and smallest at the extremes, where a box score is either clearly great or clearly bad.
Where the Estimate Misses Most, and Why
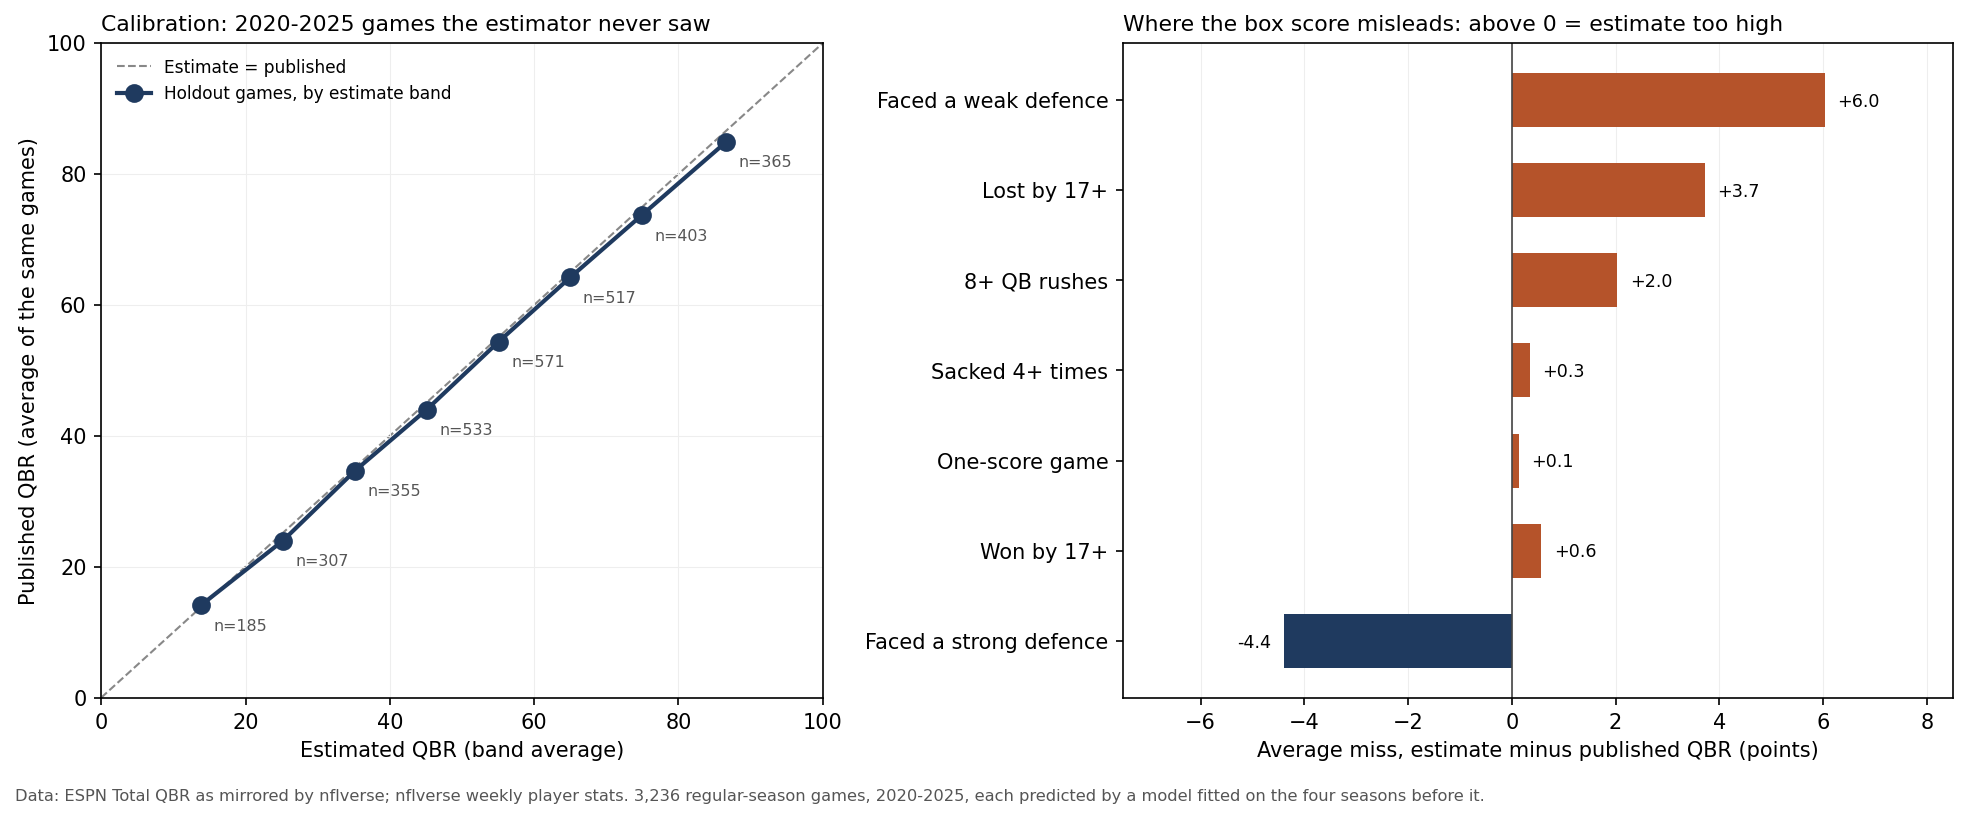
ESPN’s own data carries some of what a box score leaves out, so the 3,236 test-game misses can be lined up against it:
- The defence faced. ESPN publishes a raw QBR next to the total; the gap between them is its opponent adjustment. Against weak defences (an adjustment of 3 points or more down) the estimate ran 6.0 points too high on average, and against strong ones 4.4 points too low. This one factor accounts for 11.0% of the variation in the misses, the largest single share.
- Garbage time. In losses by 17 or more the estimate was 3.7 points too high: yards piled up when the game is gone count fully in a box score, while QBR discounts plays that cannot change the result. In wins by 17 or more the miss was 0.6.
- Rushing. In games with 8 or more QB rushes the estimate was 2.0 points too high; ESPN’s rushing points per play explain 5.8% of the misses. A box score cannot tell a third-down scramble from a kneel-down.
- Penalties and first downs. QBR counts penalties attributable to the quarterback as plays; a box score has none. Penalty points per play explain 1.8% of the misses, first downs 1.2%, the final margin 0.9%.
All six of those together explain 24.4% of the variation. The other 75.6% is play-level detail no box score has: down, distance and field position, how much of a completion came after the catch, and how ESPN divides credit between the quarterback and his receivers and line.
The biggest 2026 misses fit that picture. Dak Prescott is 17.1 points under his published 78.3: ESPN counts 465 action plays for him against 431 box-score plays, and his penalty points per play are the highest of the 31, value the box score never sees. Jordan Love (16.7 under) and Bryce Young (13.5 under) follow. At the other end, Deshaun Watson is 5.9 points over his published figure.
What This Estimator Cannot Do
- It is not QBR. ESPN’s figure is the only Total QBR. For a single game, expect the estimate to miss by around 11 points; half of games land within about 10.
- Small samples. ESPN publishes a game QBR only with 20 or more action plays, so the fit has no game below that. Under 20 plays the calculator still answers, with a warning.
- Coverage. Regular seasons only: 2006-2025 and 2026 weeks 1-10 (10,554 quarterback games kept; 34 had no player-ID match between ESPN and nflverse and 1 had an impossible box line). No playoff games.
- Season lines. The model is fitted on games and applied to season totals. That works (an average miss of 4.5 on 308 qualified seasons), but ESPN’s season QBR is computed from every play of the season, not from game QBRs, so the two can drift apart.
- Drift. The relation between box scores and QBR moves from era to era, which is why the model uses only the last four seasons. 2026 is running a few points above it so far.
Method and Sources
- Target: ESPN Total QBR (the published total, opponent-adjusted) for each quarterback game, regular seasons 2006-2025 and 2026 weeks 1-10, from nflverse’s espn_data release; season QBR from the same release.
- Inputs: the eleven box-score numbers from nflverse weekly player stats; fumbles lost = lost fumbles on sacks and runs. ESPN and nflverse player IDs matched through nflverse’s players table.
- Fit: a logistic curve, least squares on the QBR scale; test seasons each predicted from the four seasons before them; shipped model fitted on 2022-2025 (2,173 games).
- What QBR is: ESPN’s 2011 launch release (expected points, division of credit, the weight of close games) and Wikipedia’s Total quarterback rating (proprietary, the garbage-time discount, the opponent adjustment, 0-100 with 50 average).
- Checks: the calculator’s JavaScript, run as shipped, matches the Python reference on every test line and on 10,000 random lines; every figure on this page is recomputed from the frozen data before the page is built. Data pulled November 20, 2026; weeks 1-10 only (ESPN’s QBR release had not yet added Thursday night’s week-11 game).
Related: Passer rating calculator · Passer rating vs. QBR · NFL QB rankings by EPA and CPOE · NFL QB power rankings · EPA calculator
Go deeper
Plain-English guides to the metrics, and the full code-first tutorial.
Explainers Tutorials