The Finding: Playing at Home Still Helps, But Less Than It Used To
For most of NFL history, "home-field advantage" was treated as a fixed law of the sport — worth about three points on the spread, full stop. The data says otherwise. I pulled the complete nflverse game log bundled with this site — 7,548 games, of which 7,182 are played, true-home-field contests across the 27 seasons from 1999 through 2025 — and computed home win percentage for every season. The long-run number is real and meaningful: home teams have won 56.6% of the time, by an average margin of +2.4 points. But that headline average hides a clear, sustained decline. The advantage you see today is materially smaller than the one that existed when this dataset begins.
This is not a hot take or a small-sample blip. It is the same direction every credible analysis has found over the past decade, and below I show you exactly how I got the numbers, the chart that makes the trend visible, and — just as important — the reasons you should be careful about why it is happening.
The Exhibit: Home Win% by Season, 1999–2025
Here is the real picture. Each bar is one season's home win percentage, computed from every played home-site game in the dataset (ties counted as half a win, the standard convention). The navy dashed line is the 27-season mean of 56.6%; the dotted line marks the 50% coin-flip baseline you would expect if the venue meant nothing. The two amber bars are the seasons home teams fell below 52%.
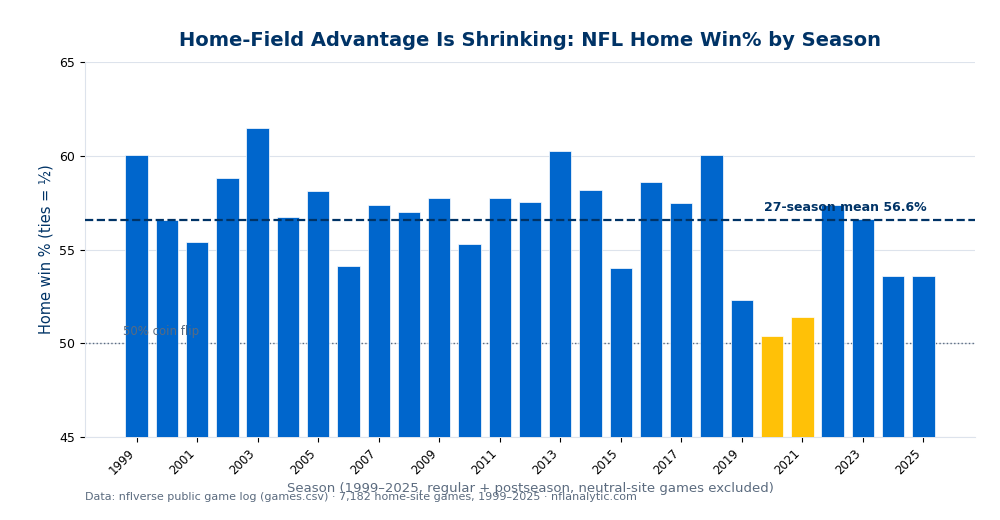
Read the chart left to right and the story is hard to miss. The 2000s are a wall of high-50s and low-60s bars — 2003 peaks at 61.5%, and 1999, 2013, and 2018 all sit at 60%. Then the floor drops out: 2019 (52.3%), 2020 (50.4%), and 2021 (51.4%) form a three-season trough where home field nearly vanished. The most extreme single season is 2020 at 50.4% with an average home margin of just +0.2 points — essentially a coin flip. Home field recovered somewhat in 2022 (57.4%), but 2024 and 2025 settled back into the low 50s (53.6% each), well below the dataset's early-era norm.
That last pair is the cleanest way to state the trend: split the dataset at 2019 and home win% drops from 57.6% across the first twenty seasons to 53.7% across the last seven — roughly a four-percentage-point fall, with average home margin sliding from +2.7 to +1.7 points. The advantage is real, but it is a fraction of the old "three points, automatically" rule of thumb.
A Worked Example: How "Home Margin" Is Computed
Everything above rests on one simple, transparent quantity: the home margin for each game, which the dataset stores in the result column as home score minus away score. A positive number is a home win, negative is a home loss, zero is a tie. Let me step through two real games from Week 1 of the very first season in the data so the calculation is concrete.
Two real games, September 12, 1999
Game 1 — Vikings at Falcons (1999_01_MIN_ATL): Minnesota scored 17, Atlanta (the home team) scored 14.
result = home_score − away_score = 14 − 17 = −3
A negative result, so the home team lost by 3. This game counts as a home loss and contributes −3 to the season's average margin. (Note: Atlanta were 4-point home favorites — spread_line = −4 — so the home side underperformed the market here, a separate question from whether they were home.)
Game 2 — Chiefs at Bears (1999_01_KC_CHI): Kansas City scored 17, Chicago (home) scored 20.
result = home_score − away_score = 20 − 17 = +3
A positive result: the home team won by 3. This counts as a home win and contributes +3 to the average margin.
To get a season's home win%, I count every game where result > 0 as a win, every result == 0 as half a win, divide by the number of games, and multiply by 100. To get the season's average margin, I take the mean of result across all home-site games. That is the entire method — there is no model, no adjustment, and nothing hidden. Two games like the ones above, one home loss and one home win, would average to exactly 50% and a 0.0 margin; aggregate thousands of them per season and the real signal emerges.
Reproduce It: The Exact Query
Honesty in analytics means you can rerun the work. The chart and every figure on this page come from this pandas code, run against data_layer/games.csv (the same nflverse export bundled with the site). Two filters matter and are applied up front: drop unplayed/future games (rows with no score), and exclude neutral-site games — international and Super Bowl games — because there is no true home field to measure.
import pandas as pd

df = pd.read_csv("data_layer/games.csv")

# 1. played games only (drop scheduled/unplayed rows)
df = df.dropna(subset=["home_score", "away_score"])
# 2. true home field only (exclude neutral-site games)
df = df[df["location"] == "Home"].copy()

# home win% (ties = half a win) and average home margin, by season
def home_win_pct(g):
    wins = (g["result"] > 0).sum()
    ties = (g["result"] == 0).sum()
    return (wins + 0.5 * ties) / len(g) * 100

by_season = df.groupby("season").apply(
    lambda g: pd.Series({
        "n": len(g),
        "home_win_pct": home_win_pct(g),
        "avg_margin": g["result"].mean(),
    })
)
print(by_season)
print("overall:", home_win_pct(df), df["result"].mean())
That result column is just home score − away score, exactly as worked through above — nflverse computes it from the same box scores you can verify anywhere. The full script that renders the chart (explainer_src/make_hfa_chart.py) does nothing more than this groupby plus matplotlib. Run it and you will reproduce 56.6% overall and every per-season bar.
Honest Limitations: What This Number Does and Doesn't Tell You
The decline is real. Why it is happening is much harder, and any analyst who tells you they know the single cause is overselling. Home-field advantage is a bundle of distinct effects, and raw win% can't separate them.
A home team benefits from crowd noise, no travel, sleeping in its own bed, familiarity with the field and conditions, and friendly scheduling (e.g., a road team on a short week). Win% lumps all of these together. If travel and rest effects shrink — charter logistics and rest-day scheduling have both improved — the crowd effect could be unchanged while the total still falls.
2020 was played in empty or near-empty stadiums, and home win% fell to 50.4% — a near-perfect natural experiment that crowd noise matters. But that makes 2020–2021 partly a one-off shock, not pure trend. The recovery to 57.4% in 2022 (full crowds back) and the slide again in 2024–2025 show the story is not monotonic.
A raw home-win count says nothing about who was home against whom. In any given season, the schedule isn't perfectly balanced, and unbalanced strength on the home slate can nudge the number. The long-run average across 7,182 games washes most of this out, but single-season bars carry it.
I include the postseason, where home teams are seeded by being better — that inflates home win% slightly versus a regular-season-only cut, and the playoff field is itself a survivorship-selected sample. Counting ties as half-wins and excluding neutral sites are defensible choices, but different reasonable choices would move the decimals.
How This Connects to the Rest of the Toolkit
A shrinking, variable home-field edge ripples through almost every other metric on this site. A few direct links:
- Win probability. Live win-probability models start every game from a pre-snap prior that bakes in home field. If that prior is built on a stale "three points at home" assumption, the model is miscalibrated from the opening kickoff. A smaller, time-varying HFA means the prior should be smaller and updated, not fixed.
- Strength of schedule. Opponent-adjustment systems like the ones in our strength-of-schedule explainer apply a home/road correction to every game. The size of that correction is exactly the HFA number computed here — get it wrong and every team's adjusted rating tilts.
- Pythagorean wins. Our Pythagorean method turns points scored and allowed into expected wins. Average home margin (+2.4 over the full set, but only +1.7 lately) is one of the structural inputs that determines how much scoring a typical schedule produces.
The throughline across all three: home field is not a constant you can hard-code once. It is a measured quantity that has trended down, and the honest move is to recompute it from current data rather than inherit a number from the 2000s.
Put the Numbers to Work
Want to fold a realistic home-field number into your own estimates? The site's NFL Calculators page runs entirely in your browser with your inputs — including a Pythagorean expected-win% tool and a transparent expected-points model for fourth-down and two-point decisions. Use the recent-era home margin (closer to +1.7 than +3) when you set up a game-state estimate, and you will be working from what the data actually says today.
Open the NFL CalculatorsThe Bottom Line
Across 27 NFL seasons and 7,182 played home-site games (1999–2025), home teams won 56.6% of the time by an average of +2.4 points — a real advantage, but a declining one. The first twenty seasons ran at 57.6%; the last seven have run at 53.7%, with the 2019–2021 stretch (bottoming at 50.4% in the empty-stadium 2020 season) the clear trough. The method behind that finding is deliberately simple and fully reproducible: result is home score minus away score, win% counts positive results as wins, and the chart is a groupby over the bundled nflverse log. What the number can't tell you is the cause — crowd, travel, rest, scheduling, and officiating are all tangled together — so treat "home field" as a measured, shrinking quantity to recompute, not a constant to assume.
Primary Sources & Further Reading
- Chapter 25: Home Field Advantage Deep Dive covers the foundations; it’s free to read at DataField.dev.
- nflverse — the open, public NFL data project; the
games.csvgame log analyzed here (including theresult,spread_line, andlocationfields) is built on its schedules dataset. - Pro-Football-Reference — box scores and historical home/road splits you can use to verify any single game's
result. - Moskowitz, T. & Wertheim, L. J., Scorecasting (2011) — the influential argument that the bulk of home-field advantage across sports traces to officiating bias under crowd pressure, not "the crowd lifting the home team."
- The documented HFA-decline literature — analysts at outlets such as FiveThirtyEight, The Athletic, and the football-analytics community have tracked the same downward trend and the betting market's drift from ~3 points toward ~1.5; the per-season numbers here are consistent with those findings.
- Win Probability and Leverage, Strength of Schedule, Adjusted, and Pythagorean Wins — the on-site explainers that consume a home-field correction.
Go deeper
Want the code behind these metrics? Work through the 45-chapter NFL analytics tutorial.
Browse tutorials Free tools