The finding: half of all NFL games are one-score games
Ask why the NFL is the most popular sport in America and the honest answer is competitive balance: on any given Sunday almost anyone can beat almost anyone, and most games stay in reach until late. That's the marketing line. It's also true. I pulled the complete nflverse game log bundled with this site — 7,276 played games from 1999 through 2025 — and classified every result by its final margin. 50.7% of all NFL games are decided by eight points or fewer — a one-score game, still winnable with a single touchdown and a two-point conversion on the last possession. Blowouts, which I'll define as a margin of 17 or more, account for 26.9%. The remaining 22.4% land in the two-score middle.
And the balance is improving. Split the 27 seasons into four eras and the one-score share climbs from 49.9% in 1999–2004 to 52.7% in 2017–2025, while blowouts fall from 27.3% to 25.6%. Despite constant hand-wringing about super-teams and tanking, NFL games have gotten slightly closer over time, not more lopsided.
The exhibit: closeness by era
Here is the share of one-score games (final margin 8 or fewer) against the share of blowouts (17 or more), in four roughly equal eras, straight from /data/games.csv.
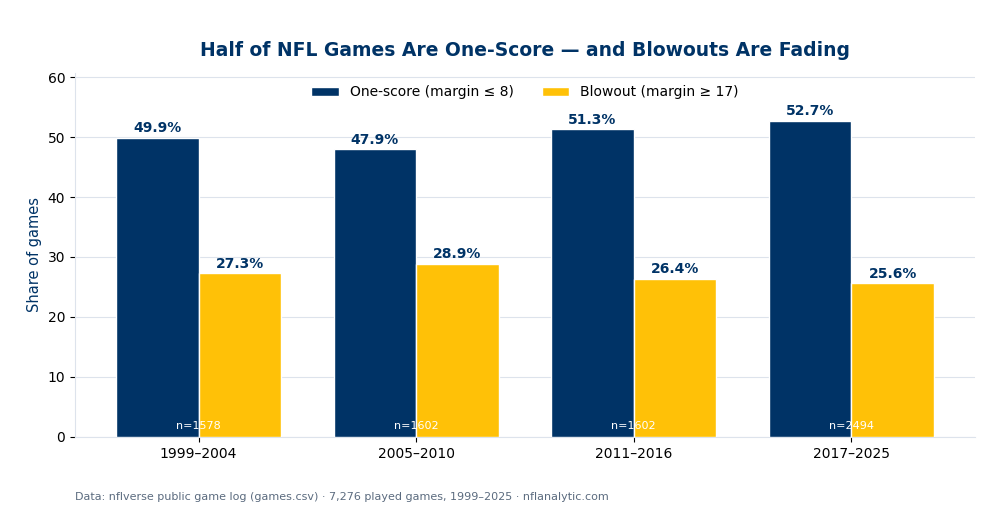
The two lines mirror each other, which is what genuine competitive tightening looks like: as more games end within a score, fewer end in a rout, and the two-score middle stays roughly flat. The 2005–2010 era is the one blip toward blowouts, but the overall arc bends toward closer games. A margin-of-eight cutoff isn't arbitrary, either — it's the largest deficit a team can erase with one possession (touchdown plus a two-point conversion), so it's the natural boundary of "still a game."
Why so many games stay close
Two forces push NFL results toward the middle. The first is structural parity: a hard salary cap, a worst-pick-first draft, revenue sharing, and scheduling that gives easier slates to last year's weak teams all compress the talent gap between the best and worst rosters. Fewer true mismatches means fewer routs.
The second is the math of a low-scoring, high-variance sport. Football games have relatively few scoring events, and each one is a big lump — three or seven points at a time. That makes single plays enormously leveraged: one turnover, one long touchdown, one missed field goal can swing a game, so even a clearly better team rarely pulls away cleanly. The same lumpiness that makes 3 and 7 the key numbers also keeps scores from separating. A modest late lead is one busted coverage from disappearing, which is precisely why so many games are still one-score affairs at the two-minute warning.
A worked example: what "one-score" is really counting
Break the one-score half into its parts and you can see how tightly packed NFL finishes are. Of all 7,276 games, ties are vanishingly rare at 0.2%; games decided by 1–3 points make up 23.3%; and games decided by 4–8 points add another 27.2%. Add them and you get the 50.7% one-score figure. Nearly a quarter of every NFL game ever played is settled by a field goal or less. That's the statistical signature of a league engineered so that the final drive matters — and it's why win-probability graphics and late-game fourth-down decisions get so much airtime. In half of all games, the last possession is playing for the win or a tie.
Honest limitations
- Final margin hides the path. A game that was 24–3 in the fourth quarter and ended 24–20 counts as one-score, even though it was never close. Garbage-time comebacks and cover-driven late scores inflate the one-score bucket relative to how competitive games actually felt. Margin is an endpoint, not a story.
- The cutoffs are conventions. Eight points for one-score and seventeen for a blowout are sensible and common, but they're choices. Move the blowout line to 14 or 21 and the exact percentages shift, though the upward trend in closeness survives reasonable definitions.
- Overtime compresses margins. Games that reach overtime are guaranteed to finish within one score, so the modern rules that affect overtime frequency feed the one-score bucket slightly. It's a small effect on a 6%-of-games sliver, but it's real.
- Closeness is not unpredictability. A game can be close and still be exactly what the market expected. The point spread anticipates a lot of these tight finishes; a one-score game is not the same thing as an upset.
Reproduce it
Load /data/games.csv, keep rows with a real result, take its absolute value for the final margin, and tally the share at or below 8 (one-score), at or above 17 (blowout), and in between. Group by season era to see the trend. The chart and full console breakdown are produced by explainer_src/make_one_score_chart.py, which reads the bundled nflverse log directly and stamps a “Data: nflverse” footer. No network, nothing hand-entered.
Further reading
- Further reading: Chapter 22: Betting Market Analysis, DataField.dev.
- Why 3 and 7 are the NFL's key numbers — the fine structure of the margin distribution that this piece buckets.
- How often do NFL games go to overtime? — the closest of the close games, and why more of them end in ties now.
- Is the NFL higher-scoring than it used to be? — scoring rose while games stayed close, which is not a contradiction.
- How accurate is the point spread? — why close does not mean surprising.
Go deeper
Want the code behind these metrics? Work through the 43-chapter NFL analytics tutorial.
Browse tutorials Free tools