The finding: NFL games don't land on random numbers
Ask a casual fan how often an NFL game is decided by exactly 3 points and they'll shrug. Ask a bettor and they'll tell you instantly, because it's the most important number in football. I pulled the complete nflverse game log bundled with this site — 7,276 played games from 1999 through 2025 — and tallied the final margin of victory. The result isn't a smooth curve. It's a skyline with two towers: 15.1% of all games are decided by exactly 3 points, and 9.0% by exactly 7. Nearly a quarter of every NFL game ever played — 24.1% — ends on one of those two numbers. The reason is baked into the sport's scoring, and it's why 3 and 7 are called the “key numbers.”
The exhibit: the margin-of-victory skyline
Here is how often games end at each margin, straight from data_layer/games.csv. Watch the spikes.
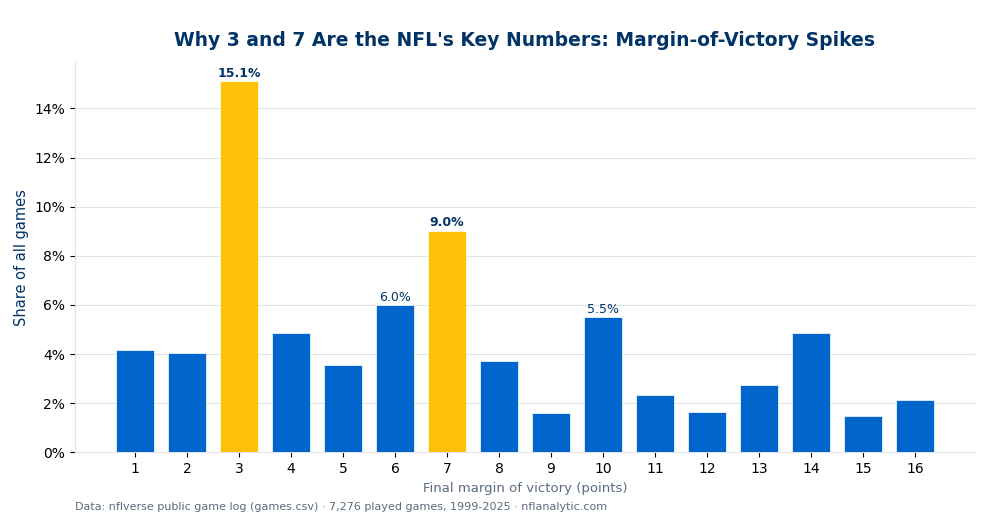
The towers at 3 and 7 dwarf their neighbors, and the next-tallest bars — 6, 10, 14 — aren't random either. Every spike is a clean sum of the sport's two scoring units: a field goal (3) and a touchdown (7). 6 is two field goals, 10 is a touchdown plus a field goal, 14 is two touchdowns. The valleys in between (5, 8, 9, 11) are the awkward margins that require missed extra points, safeties, or two-point conversions to reach — so they're rare.
Why the scoring system builds the spikes
Football scores in lumps of 3 and 7, so the difference between two scores piles up on multiples and combinations of 3 and 7. A game where one team kicks a field goal more than the other ends with a 3-point margin; one extra touchdown makes it 7. Because those are the two most common ways for one team to edge ahead, 3 and 7 become the most common final margins by a wide distance. The whole distribution is the footprint of a scoring system with no 1s, 2s, or 4s in its base units.
Why bettors obsess over 3 and 7
This is where key numbers stop being trivia and start being money. A point spread is a bet on the margin, so where the spread sits relative to 3 and 7 matters enormously. The difference between laying −2.5 and −3.5 is not half a point of nothing — it's the difference between winning and losing every single one of the 15% of games that land exactly on 3. That's why you'll see a line stick stubbornly at 3, why moving off 3 (“buying the half-point” to 2.5 or 3.5) is priced at a premium, and why sharp bettors care far more about the exact number than the casual eye would think. The same logic, smaller, applies at 7. A spread that crosses a key number is worth real expected value; one that doesn't is just decoration.
A worked example: the cost of the hook
Suppose you can bet a team at −3 or pay a worse price for −2.5. Is the half-point worth it? With ~15% of games landing exactly on 3, taking −2.5 turns every 3-point win from a push (at −3) into a win — you now win the games that land on 3 instead of getting your money back. Over a season that converts a meaningful slice of pushes into wins, which is exactly why books charge extra for it. Conversely, a team getting +3 versus +2.5 wants the +3: it pushes (refunds) on the 3-point loss instead of losing it. The entire half-point market exists because of that single 15.1% tower in the chart.
Honest limitations
- Key numbers drift slowly. As scoring and two-point conversions evolve, the exact heights move a little — 3 has softened slightly and 8 has grown as two-point tries became more common. The dominance of 3 and 7 is stable, but the precise percentages reflect the whole 1999–2025 span.
- This is all games pooled. Margins depend on how close a game was expected to be; the distribution for pick'em games differs from blowout-favorite games. The overall skyline is the aggregate, not a fixed law for any single matchup.
- The betting takeaway isn't a strategy. Knowing 3 is a key number doesn't beat the market — the market already prices it (that's why the line sticks at 3). It explains why half-points cost what they do, not how to profit.
- Overtime compresses margins. Games that reach overtime are decided by a field goal or touchdown in the extra period, which feeds the 3 and (sudden-death era aside) low-margin spikes.
Reproduce it
Load data_layer/games.csv, take the absolute value of result, and tally the share of games at each margin. The chart is produced by explainer_src/make_key_numbers_chart.py, which reads the bundled nflverse log directly and stamps a “Data: nflverse” footer. No network, nothing hand-entered.
Further reading
- Free textbook: Chapter 22: Betting Market Analysis — the theory behind this, at DataField.dev.
- How accurate is the point spread? — why the line is unbiased on average but scatters game to game.
- How accurate is the over/under? — the same market-efficiency story for totals.
- How often do games go to overtime? — the low-margin games that feed the 3-point spike.
Go deeper
Want the code behind these metrics? Work through the 45-chapter NFL analytics tutorial.
Browse tutorials Free tools