The finding: the building is worth about 15 points
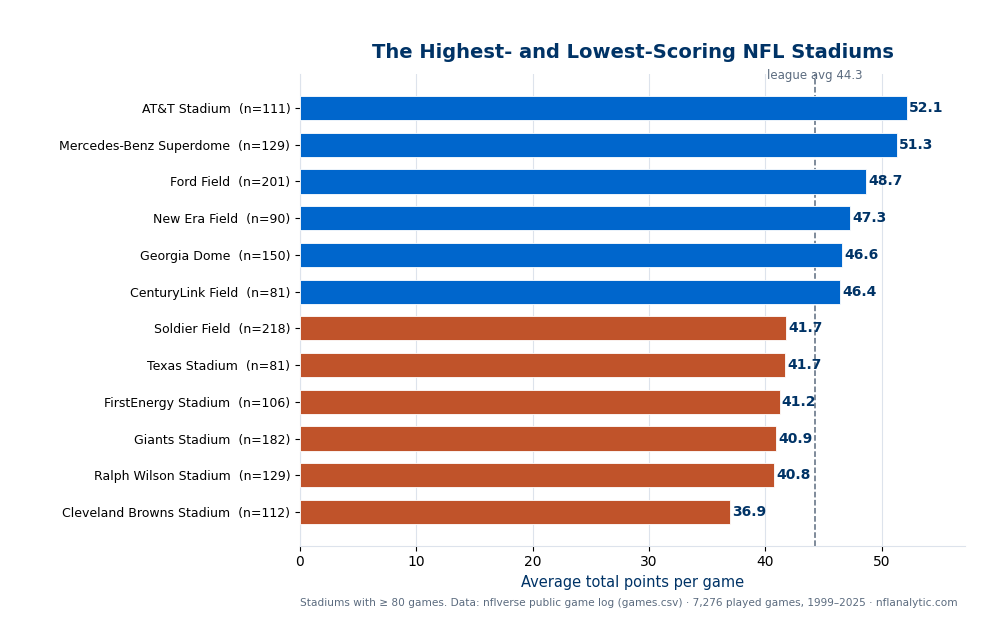
Not every home field is the same kind of place to play football, and the scoreboard knows it. I pulled the complete nflverse game log bundled with this site — 7,276 played games from 1999 through 2025 — and averaged the combined final score at every stadium with at least 80 games on record, a threshold that leaves 37 venues with stable samples. The spread between the top and the bottom is enormous. The highest-scoring building, Dallas's retractable-roof AT&T Stadium, averages 52.1 combined points. The lowest, the old lakefront Cleveland Browns Stadium, averages 36.9. That is a 15-point gap baked into the venue — larger than almost any team-quality effect — against a league average of 44.3.
The pattern down the list is not random. The top is a wall of roofs: domes and retractable-roof stadiums where weather never touches the ball. The bottom is a row of cold, windy, open-air sites near water. The venue isn't just where the game is played; it's a thumb on the scale of how much scoring you'll see.
The exhibit: the venue leaderboard
The six highest- and six lowest-scoring stadiums (minimum 80 games), average combined final score, straight from /data/games.csv.
| Stadium | Games | Avg total | Type |
|---|---|---|---|
| AT&T Stadium (Dallas) | 111 | 52.1 | Retractable roof |
| Mercedes-Benz Superdome (New Orleans) | 129 | 51.3 | Dome |
| Ford Field (Detroit) | 201 | 48.7 | Dome |
| Georgia Dome (Atlanta) | 150 | 46.6 | Dome |
| … league average … | — | 44.3 | — |
| Giants Stadium (East Rutherford) | 182 | 40.9 | Open air |
| Ralph Wilson Stadium (Buffalo) | 129 | 40.8 | Open air |
| Cleveland Browns Stadium (Cleveland) | 112 | 36.9 | Open air, lakefront |
Full top-six and bottom-six shown in the chart; abbreviated here. nflverse game log, 1999–2025.
The top four are all indoors. The bottom is entirely outdoor, and mostly cold and windy. This is the same effect the weather analysis found from the other direction — domes on top, wind dragging outdoor scoring down — now attached to specific addresses.
The best natural experiment in the data: the Cowboys and their two stadiums
The cleanest evidence that this is the building and not the team is Dallas. The Cowboys played in open-air Texas Stadium (that famous hole in the roof) through 2008, where games averaged 41.7 points — below the league average. They then moved into the fully enclosed, retractable-roof AT&T Stadium, where games average 52.1. Same franchise, same division, overlapping rosters and coaches, and scoring jumped more than ten points when the only thing that fundamentally changed was the roof over their heads. You could not design a better before-and-after: hold the team roughly constant, add a climate-controlled dome, and watch the point total climb into the fifties. Altitude does something similar in Denver, and the enclosed New Orleans and Detroit buildings sit near the top for the same reason.
Honest limitations
- Venue and team are tangled. A stadium's average is partly its home team's offenses and defenses over the years, not just the physical building. The high-scoring Saints and Lions of the 2000s–2010s inflate their domes' numbers; a great defense would pull a venue down. The roof/altitude signal is strong and consistent, but each single stadium's figure mixes environment with whoever played there.
- Name changes split one building across rows. The same physical Buffalo stadium appears twice — as Ralph Wilson Stadium (40.8) and, after its 2016 renaming, as New Era Field (47.3) — because the file tracks the sponsor name, not the address. The gap between those two rows is era and a smaller, noisier recent sample, not two different buildings. Cleveland's stadium likewise appears under two names, both near the bottom. Read venues, not brand labels.
- Unequal and modest samples. Eighty games is enough to be stable but not immovable; a venue near a cutoff can shift a point or two with a few shootouts. Retractable-roof stadiums are also counted with the roof sometimes open, which blends environments within a single row.
- Eras are pooled. Leaguewide scoring rose over the 27 seasons (see the scoring trend), so newer stadiums that only exist in the high-scoring 2010s–2020s get a small tailwind that older, since-demolished venues never had.
Reproduce it
Load /data/games.csv, keep rows with a real total and a stadium name, group by stadium, and take the mean of total for every venue with at least 80 games. Sort to get the top and bottom. The chart and full console breakdown are produced by explainer_src/make_stadium_chart.py, which reads the bundled nflverse log directly and stamps a “Data: nflverse” footer. No network, nothing hand-entered.
Further reading
- Chapter 25: Home Field Advantage Deep Dive — DataField.dev.
- Weather and NFL scoring — the mechanism behind the leaderboard: domes score, wind suppresses, cold barely matters.
- Grass vs turf — why the surface under these venues is mostly a proxy for the roof over them.
- Home-field advantage is shrinking — the other thing a home venue is supposed to provide, and how it has changed.
- How accurate is the over/under? — why the market already bakes the building into the total.
Go deeper
Want the code behind these metrics? Work through the 43-chapter NFL analytics tutorial.
Browse tutorials Free tools