The Question: Does Anyone Get Shut Out Anymore?
Every time a scoreboard shows a zero after sixty minutes, the broadcast reaches for the same framing: a relic, a throwback, "you just don't see this anymore." It's a checkable claim, because the nflverse game file carries the final score of every NFL game since 1999. This page counts all of it: 7,276 played games from 1999 to 2025, playoffs included, of which 187 ended with one team on zero — about one game in 39.
The Exhibit: 27 Seasons of Blankings
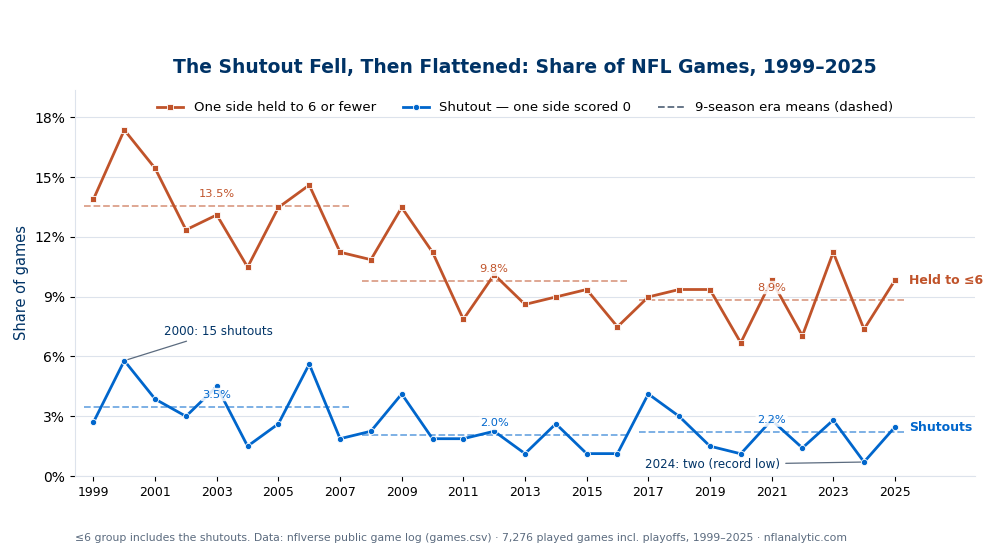
Two lines per season: the share of games in which one side scored 0, and the share in which one side was held to 6 or fewer (the second group includes the first). The dashed segments are the averages of the three 9-season eras.
| Era | Games | Shutouts | Shutout rate | Per season | One side ≤6 |
|---|---|---|---|---|---|
| 1999–2007 | 2,379 | 83 | 3.49% | 9.2 | 13.54% |
| 2008–2016 | 2,403 | 49 | 2.04% | 5.4 | 9.78% |
| 2017–2025 | 2,494 | 55 | 2.21% | 6.1 | 8.86% |
| All games | 7,276 | 187 | 2.57% | — | 10.69% |
The extremes frame the era. 2000 and 2006 each produced 15 shutouts (5.79% and 5.62% of their games) — a pace the league hasn't approached since. At the other end, 2024 produced exactly two, an all-time low for the file at 0.70%: New Orleans blanked 34-0 at Green Bay on December 23, and Kansas City blanked 38-0 at Denver in Week 18. Between those poles, single seasons bounce hard: 2017 spiked to 11 shutouts (4.12%) in the middle of the supposedly shutout-proof modern era, while 2013, 2015, 2016, and 2020 managed just three apiece.
And one near-miss of history: in 7,276 games there is not a single 0-0 tie. Somebody has scored in every NFL game in the file.
The Honest Read: It Fell, Then It Flattened
The era table says the shutout collapsed between the 2000s and the 2010s — from 9.2 a season to 5.4 — and then quietly stopped collapsing. The last nine seasons actually run slightly above the middle era (2.21% vs 2.04%). "The shutout is dying" was true a decade ago; the honest present tense is "the shutout already died halfway, and has held there since."
Why trust the near-shutout line more? Counts. A shutout season is a sample of 2 to 15 events, so the blue line is mostly noise wrapped around a step down. The ≤6 group runs four times larger (778 games total vs 187) and behaves accordingly: its correlation with the season number is r = −0.77, versus −0.48 for shutouts. Being held under a touchdown is the signal; the zero itself is the garnish on top of it.
The slide also isn't an artifact of where the threshold sits. Held to 3 or fewer: 9.37% → 5.95% → 5.77% across the three eras. Held to 9 or fewer: 23.75% → 17.69% → 16.64%. Every version of "offense had a terrible day" shows the same shape — a big drop into the 2010s, then a flattening — which is exactly the shape of the league's scoring rise generally (about four points a game over the span; see the scoring trend explainer).
What you cannot get from final scores is the cause. The candidate list is long and bundled: the 2004 point of emphasis on illegal contact, the expanding defenseless-receiver protections, the 2011 kickoff changes, the 2018 helmet and roughing enforcement, two decades of quarterback-friendly scheme evolution, and the analytics-era habit of going for it on fourth down rather than punting the ball back. All of those pushed scoring up during the same years, and a file of finals cannot separate them. This page claims the trend; it does not claim which rule built it.
Worked Examples: The Zeroes Worth Knowing
All of these are straight rows from the game file:
- The biggest blankings. New England 59-0 over Tennessee (October 18, 2009) is the largest shutout in the file, with Seattle 58-0 over Arizona (December 9, 2012) one point behind, and the St. Louis Rams 52-0 over Oakland (November 30, 2014) third. The pre-2009 heavyweights: Kansas City 49-0 over Arizona in 2002 and Jacksonville 48-0 over Cleveland in 2000.
- The smallest. Pittsburgh beat Miami 3-0 on November 26, 2007 — the lowest-scoring game in the entire file — and the league didn't see another 3-0 final until Minnesota won 3-0 in Las Vegas on December 10, 2023 — the only two in the file. Four games finished 6-0: the Jets over Pittsburgh (2003), Dallas at Philadelphia (2017), Jacksonville over Indianapolis (2018), and the Chargers at New England (2023).
- The most recent, and a busy 2025. The 2025 season produced seven: Carolina 30-0 over Atlanta (September 21), Houston 26-0 over Tennessee (September 28), Kansas City 31-0 over Las Vegas (October 19), Seattle 26-0 over Minnesota (November 30), Minnesota 31-0 over Washington (December 7), and then a double on December 14, 2025 — Philadelphia 31-0 over Las Vegas and Baltimore 24-0 at Cincinnati — the first day with two shutouts since December 30, 2018. Note the Vikings' whiplash: blanked 26-0 in Seattle, then handing Washington a 31-0 blanking seven days later.
- The zero that meant nothing. Kansas City was shut out 38-0 in Denver on January 5, 2025 — and played in the Super Bowl five weeks later (losing 40-22 to Philadelphia on February 9). A Week 18 blanking with seeding settled is a fact in the file, not a verdict on a team.
- The drought, bookended by one victim. The longest shutout-free stretch in the file ran 363 days: from New England 33-0 at the Jets on October 21, 2019, to the Jets losing 24-0 in Miami on October 18, 2020. The same franchise absorbed the last shutout of the old drought and the first of the new era.
- Playoff shutouts are the real endangered species. Five in 27 postseasons: Oakland 27-0 over Miami and the Giants 41-0 over Minnesota (both January 2001), the Jets 41-0 over Indianapolis (January 2003), Carolina 23-0 at the Giants (January 2006), and Kansas City 30-0 at Houston on January 9, 2016 — and none in the ten postseasons since.
Honest Limitations
- Shutouts are a tail statistic. Per-season counts run from 2 to 15, so any single season — 2024's two, 2017's eleven — is a weak draw from a noisy process, not a regime change. Era averages are the readable unit here, which is why the chart dashes them.
- The era boundaries are choices. The 9-season thirds were picked for equal game counts (2,379 / 2,403 / 2,494), not for football reasons. Split the file in halves instead and you get 3.12% (1999–2012) vs 1.99% (2013–2025) — the drop survives any reasonable cut, but the exact levels move with the knife.
- No causal attribution. Rule changes, enforcement points of emphasis, scheme evolution, and fourth-down aggressiveness all moved together across these years. Final scores can measure the sum, not the parts.
- Playoffs are included. All rates pool regular season and postseason; 5 of the 187 shutouts are playoff games. Seasons also grew — from 259 played games in 1999 to 285 in 2025 — which is why everything here is a rate, not a count, except where counts are the story.
- Franchise tallies are trivia, not character. Miami has been blanked the most (15 times), ahead of Cleveland (13) and Cincinnati and the Jets (11 each); Baltimore has pitched the most (15), ahead of New England (14). Those spans cover 27 years of completely different rosters.
- Definitions. A shutout is any game where one side scored 0 (there are no 0-0 games, so "one side" is never both). The ≤6 group includes the shutouts. The blanked team was the road team in 118 of 187 shutouts (63%) — consistent with home-field advantage, but a descriptive split, not a causal one.
How to Actually Use This
- Calibrate the extinction talk. The modern base rate is about six shutouts a season — one every 45 games or so in the 2017–2025 era. When a broadcast calls a shutout a unicorn, the honest framing is "a 1-in-45 event" — genuinely rare, nowhere near extinct.
- The floor moved more than the zero did. If you model team scoring, the actionable change isn't the shutout rate — it's that an offense's terrible days got less terrible: about one game in eleven now ends with a side under 7 points (8.9%), versus one in seven (13.5%) in the early 2000s. That reshapes the low tail that the most common final scores are built on.
- Expect zeroes in December. 42.8% of all shutouts land in week 13 or later, versus 34.6% of games generally — the same late-season sag that shows up in scoring by week. A December blanking is the least surprising kind.
- Never read a blanking as a season verdict. The 2024 Chiefs were shut out 38-0 and played the Super Bowl five weeks later; the 2025 Vikings were blanked and threw a blanking of their own a week later. One game is one game — the same lesson the one-score-games data teaches about NFL noise generally.
Reproduce It
One public file: games.csv from nflverse nfldata, bundled at /data/games.csv. Take every played game, compute the losing side's score, and count zeroes (and ≤6s) per season. The chart and the full console breakdown come from explainer_src/make_shutout_chart.py; the core fits in a dozen lines of pandas:
import pandas as pd

df = pd.read_csv("https://nflanalytic.com/data/games.csv")
g = df.dropna(subset=["home_score", "away_score"]).copy()   # 7,276 played games
g["lo"] = g[["home_score", "away_score"]].min(axis=1)       # losing side's points

print(len(g), int((g.lo == 0).sum()))            # 7276 187
per = g.groupby("season").agg(
    games=("lo", "size"),
    shutouts=("lo", lambda s: int((s == 0).sum())),
    under7=("lo", lambda s: int((s <= 6).sum())))
print(100 * per.shutouts / per.games)            # the blue line
print(100 * per.under7 / per.games)              # the rust line

for a, b in ((1999, 2007), (2008, 2016), (2017, 2025)):
    e = g[g.season.between(a, b)]
    print(a, b, round(100 * (e.lo == 0).mean(), 2),
          round(100 * (e.lo <= 6).mean(), 2))
# 1999 2007 3.49 13.54   2008 2016 2.04 9.78   2017 2025 2.21 8.86

recent = g[g.lo == 0].sort_values("gameday").tail(2)
print(recent[["gameday", "away_team", "away_score",
              "home_team", "home_score"]])       # the Dec 14, 2025 double
All figures on this page were computed 2026-07-26 on the 1999–2025 file (the 272 scoreless 2026 schedule rows drop out of the played-games filter). Numbers will shift slightly as future seasons append.
Data: nflverse/nfldata, public. All rates pool regular season and playoffs; the ≤6 group includes the shutouts by construction; ties never appear here because a 0-0 final has never occurred in the file.
Your team
Kept in this browser only.
Pick the playoffs
Pick the games left and see both conferences’ seeds under the NFL’s tie-breakers.
Go deeper
Want the code behind these metrics? Work through the 43-chapter NFL analytics tutorial.
Browse tutorials Free tools