The finding: the spread is a nearly-perfect guess at the average — and a terrible guess at any one game
The point spread gets talked about as if it were either an oracle or a con. It is neither. I pulled the complete nflverse game log bundled with this site — 7,548 games — filtered to the 7,276 played games that carry a closing spread, and measured the one thing that actually matters: how far the spread's prediction landed from the real result. The answer is two numbers that pull in opposite directions, and you have to hold both at once to understand what a spread is.
First, the spread is almost exactly unbiased. Treat the closing line as a forecast of the home team's final margin and subtract it from what really happened, game by game. The average of that error across 7,276 games is +0.09 points — nine hundredths of a point, on a scale where a single field goal is three. The median error is exactly zero. As an estimate of the mean outcome, the market is as close to perfect as you will ever see a forecast get.
Second, the spread is wildly wrong about individual games, and not occasionally — routinely. The standard deviation of that same error is 13.2 points, and the mean absolute error is 10.3 points. The typical game finishes about a touchdown and a half away from the number, in one direction or the other. The spread nails the center of the distribution and tells you almost nothing about where any single Sunday will land inside it.
That is the whole story in one sentence: the closing spread is a nearly-unbiased estimate of the average margin, but football outcomes scatter so enormously that the same accurate line is useless as a point prediction for any one game. Everything below is the evidence for that claim, the worked arithmetic, and the honest reasons the ~50% cover rate does not mean you can beat the book.
The exhibit: 7,276 games of spread error
Here is the distribution of spread error directly from data_layer/games.csv. For every played game with a closing line, I computed (actual home margin) − (the closing spread's predicted home margin) and binned the results. A perfect forecast would pile every game on top of the dotted line at zero.
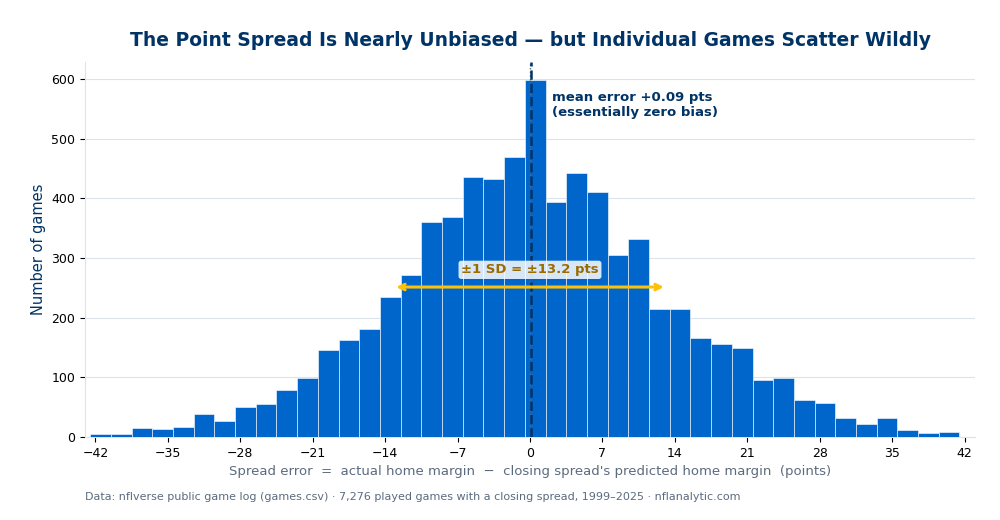
Two features carry the argument. The peak sits on zero and the navy mean line is visually indistinguishable from the dotted perfect-prediction line — that is the lack of bias. And the bell is broad: meaningful numbers of games land 20, 30, even 40 points off the number in both tails. The amber arrow spans a single standard deviation; notice how much of the chart lives outside it. A forecast can be perfectly centered and still miss by a mile on any given draw, and that is exactly what an NFL spread does.
Does the favorite cover? Almost exactly half the time
The unbiasedness shows up a second way, in cover rate. Of the 7,245 games in the file that had a favorite (a non-zero spread), the favorite covered 47.4% of the time, the underdog covered 49.9%, and 2.7% were pushes — the result landing exactly on the number. Throw out the pushes and the favorite covers 48.7% of the live bets. That is a hair under a coin flip, which is precisely what an efficient market should produce: if favorites covered 55% of the time, you could bet every favorite and print money, so the line moves until that edge is gone.
The slight tilt toward the underdog (49.9% vs. 47.4%) is small and well inside the range of documented effects in the betting literature; it is not a license to blindly bet dogs, for reasons in the limitations below. The headline is the near-symmetry. The spread's job is not to predict who wins outright — it is to find the number that splits the betting money, and a 50/50 cover rate is the signature of a line doing that job.
A worked example: Cowboys at Giants, Week 1, 2023
Abstractions hide inside averages, so take one real game from the file. On September 10, 2023, the Dallas Cowboys played at the New York Giants. The Giants were the home team; Dallas closed as a 3.5-point favorite on the road. In this dataset that is stored as spread_line = −3.5 — a predicted home (Giants) margin of negative three and a half, i.e. the model expects the home team to lose by 3.5.
What actually happened: Dallas won 40–0. The home margin (result) was −40. Run the error formula:
spread error = actual home margin − predicted home margin = (−40) − (−3.5) = −36.5 points
The Giants underperformed the spread's prediction by 36.5 points — one of the largest misses in the entire 27-season file. Was the line "wrong"? Not in the sense that matters. A 3.5-point road favorite is a perfectly reasonable central estimate; the Giants simply produced a result deep in the left tail of that bell above. This single game is one tick on the chart, sitting far out near the −36 bin. Average thousands of games like it — some +36, some −36, most within a touchdown — and the errors cancel to +0.09. That cancellation is the unbiasedness. The 36.5-point miss is the scatter. Same game, both truths.
Honest limitations: why ~50% cover does not beat the book
Everything above is real, and almost none of it is a betting edge. The caveats are the point.
- The vig eats the coin flip. A standard spread bet is priced at −110: you risk \$110 to win \$100. To break even against that price you must win about 52.4% of your bets, not 50%. A 48.7% favorite cover rate is not "close to even, so harmless" — it is a losing proposition after the house's cut. An unbiased, ~50% market is exactly the market in which the average bettor loses slowly and surely.
- Closing line ≠ opening line. Every number here is the closing spread — the line after a week of money has moved it. The closing line is the sharpest, most information-rich version of the market; it is famously hard to beat. An opening line, or a number you could have actually bet on Tuesday, is a different and generally less accurate object. "The spread is unbiased" is a statement about the closing line specifically, and the gap between open and close (closing-line value) is where professional bettors actually look for edge.
- Pushes are real and the data has them. 2.7% of games landed exactly on the number. Spreads ending in
.0can push; half-point lines ("the hook") cannot. Pooling whole and half-point lines, as this analysis does, blends two slightly different objects, and a push is a returned bet, not a win — another reason raw cover rates flatter the bettor. - Survivorship and sample. The file is regular and postseason games from 1999 onward that were actually played and actually had a posted spread. Markets, rules, and roster construction have shifted across 27 seasons; an aggregate over the whole span can mask era-to-era drift in both scoring and line accuracy. The bell is stable, but pooling decades is a simplification.
- Unbiased on average is not calibrated everywhere. A mean error of zero across all games does not guarantee zero bias in every slice — big favorites, divisional games, primetime, weather. Small, real, exploited-then-erased inefficiencies live in those slices in the academic literature; the league-wide average simply washes them out.
Reproduce it yourself
Honesty in analytics means you can rerun the work. Every figure on this page comes from this pandas snippet against data_layer/games.csv — the same nflverse export bundled with the site. Note the one verification step that comes before any analysis: confirm the sign convention. I did not assume spread_line was the predicted home margin; I checked that it correlates positively with the actual home margin (it does, r ≈ +0.43) and that its mean tracks the mean home margin (+2.25 vs. +2.34).
import pandas as pd, numpy as np

df = pd.read_csv("data_layer/games.csv")
d = df.dropna(subset=["home_score", "away_score", "result", "spread_line"])

# Verify the sign convention BEFORE analysing:
# spread_line = predicted home margin (positive = home favored).
assert d["result"].corr(d["spread_line"]) > 0          # r ~ +0.43

# Spread error = actual home margin - the spread's prediction.
err = d["result"] - d["spread_line"]
print("n            ", len(d))                          # 7276
print("bias (mean)  ", round(err.mean(), 3))            # +0.094  ~ unbiased
print("median error ", err.median())                    # 0.0
print("MAE          ", round(err.abs().mean(), 2))       # 10.27
print("std (scatter)", round(err.std(), 2))              # 13.20

# Favorite cover rate (games with a non-zero spread).
fav = d[d["spread_line"] != 0]
covered = (((fav.spread_line > 0) & (fav.result > fav.spread_line)) |
           ((fav.spread_line < 0) & (fav.result < fav.spread_line))).mean()
print("favorite cover%", round(covered * 100, 2))        # 47.41
The chart is generated by explainer_src/make_spread_error_chart.py, which runs that same verification assertion before it draws a single bar.
Where this connects
The spread is the market's single-number summary of everything the models on this site try to measure one piece at a time. A few direct links:
- Home-field advantage. The "three points at home" assumption baked into spreads is exactly the thing the home-field advantage data shows has been shrinking. A spread that still hands the home team a stale three points is mispriced in the recent era — the kind of slice-level drift the limitations above warn about.
- Win probability. The closing spread is one of the cleanest inputs to a pre-game win-probability prior: convert the predicted margin and this ±13.2-point scatter into a win chance, and you have a calibrated starting point for every live model. The huge standard deviation is also why live win probability swings so violently — a single game can finish 36 points from its own expectation.
Turn a spread into your own estimate
Want to fold these numbers into your own work? The site's NFL Calculators page runs entirely in your browser with your inputs — a Pythagorean expected-win% tool, the two-point decision, and a transparent fourth-down expected-points model. Pair a predicted margin from the spread with the ±13.2-point scatter you just saw, and you will be reasoning about a game the way the market actually does: confident about the average, humble about the single result.
Open the NFL CalculatorsSources & further reading
- For the fundamentals, see Chapter 22: Betting Market Analysis in DataField.dev’s free textbook library.
- Data: the nflverse public game log (bundled here as
data_layer/games.csv) — 7,548 NFL games, 1999–2025, including the closingspread_lineand finalresult(home margin) used throughout. - Sauer, R. D., "The Economics of Wagering Markets," Journal of Economic Literature (1998) — the standard survey of point-spread market efficiency, including the near-50% cover rate and the weak-form efficiency of betting lines.
- Levitt, S. D., "Why Are Gambling Markets Organised So Differently From Financial Markets?," The Economic Journal (2004) — evidence that books set spreads to exploit bettor biases, not merely to balance the book, which is why simple cover-rate "edges" rarely survive the vig.
- On closing-line value as the real measure of forecasting skill: the sports-betting literature's consensus that the closing line is the efficient benchmark, and that beating it — not beating 50% — is the test of an edge.
- On-site: Home-Field Advantage Is Shrinking and Win Probability and Leverage — the two metrics a spread most directly feeds.
Go deeper
Want the code behind these metrics? Work through the 45-chapter NFL analytics tutorial.
Browse tutorials Free tools