The Question: Does Winning the Opener Mean Anything?
Every September the same two takes collide. One camp declares the season over after sixty minutes of football ("they're 0-1 and the wheels are off"); the other recites "it's only one game" like a calming mantra. Both takes are checkable, because the nflverse game file records every opener and every final record since 1999. This page counts all of it: 861 team-seasons and 6,967 regular-season games (1999–2025), split by whether the team won or lost its season opener, with the postseason fate of every one of them.
The Exhibit: What 1-0 and 0-1 Starts Turned Into
Of the 861 openers, 855 were decided on the field (428 winners, 427 losers — six teams managed to tie theirs). Here is how each group's season ended, next to the all-team base rate:
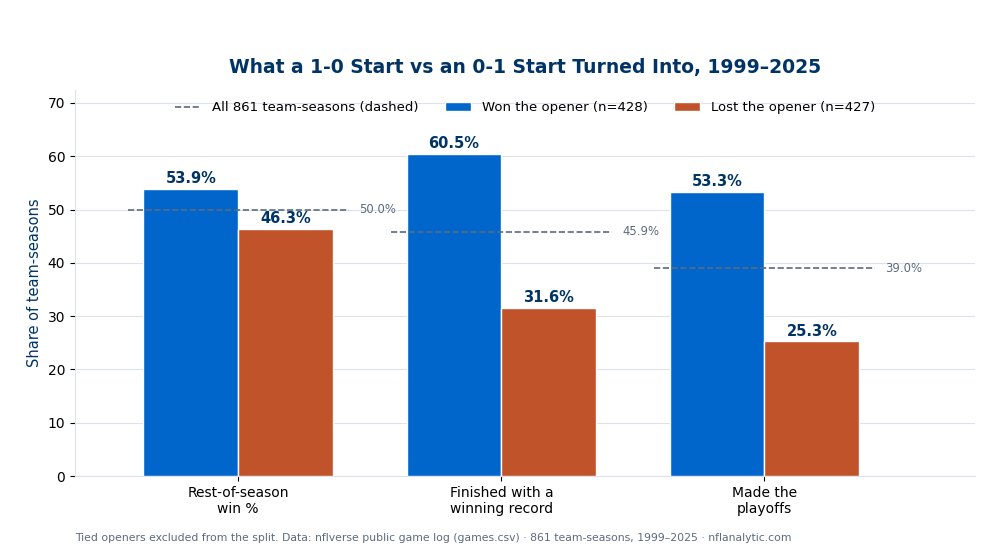
| Opener result | Team-seasons | Avg final win% | Winning record | Made playoffs |
|---|---|---|---|---|
| Won (1-0) | 428 | .567 | 60.5% | 53.3% |
| Lost (0-1) | 427 | .435 | 31.6% | 25.3% |
| Tied | 6 | .349 | 1 of 6 | 0 of 6 |
| All team-seasons | 861 | .500 | 45.9% | 39.0% |
Read as season pace, the opener winners averaged a 9.6-win pace per 17 games and the losers a 7.4-win pace — a 2.3-win gap from one Sunday. The tails spread even harder: 47.2% of opener winners reached double-digit wins versus 22.2% of opener losers. And the six teams that tied their opener went a combined-average .349 with zero playoff berths, which proves nothing at n=6 but is a fun row to have in the file.
So the "it's only one game" camp is not entitled to a shrug: conditioned on nothing else, a 1-0 team really is about twice as likely to play January football as an 0-1 team. The question is why — and that's where the overreaction camp loses.
The Honest Accounting: Half the Gap Is Arithmetic, the Rest Is Not Special
Two corrections shrink that headline gap to its honest size.
First, the mechanical part. A 1-0 team's final record contains a win the 0-1 team's record cannot contain — the opener itself is one of the 16 or 17 games being averaged. Of the .132 gap in final win% (2.25 wins per 17), .057 (43.1%) is that single game sitting in the denominator. Strip the opener out and compare only the remaining games: opener winners played .539 football the rest of the way, opener losers .463. Still a real gap — about 1.3 wins per 17 — but a much smaller one than the raw records suggest. Any stat of the form "teams that start 1-0 finish X wins better" is quietly double-counting the start.
Second, the placebo test. If Week 1 carried special information — the "statement game," the "tone-setter" — then the opener's result should predict the rest of the season better than some random mid-season game does. It doesn't. For every game number k, correlate winning game k with the team's win% in all its other games, across all 861 team-seasons:
| Game of season | Correlation with rest-of-season win% |
|---|---|
| Game 1 (the opener) | r = +0.19 |
| Games 2–16, average | r = +0.24 |
| Most predictive single game (game 11) | r = +0.30 |
| Least predictive (game 15, then game 1) | r = +0.19 |
The opener is statistically ordinary — in this sample it's tied for the least informative game of the season, not the most. Winning any single game correlates with winning the others at roughly r = +0.2 to +0.3, for the least mysterious reason in sports: good teams win games, so each win is a small piece of evidence about quality. Week 1's slight edge in noisiness fits what the schedule data show elsewhere — openers are played by rusty teams with new rosters (Week 1 is among the lowest-scoring weeks of the year; see scoring by week). An r of +0.19 squared is 3.7%: the opener explains about one twenty-seventh of the variance in what follows. The other 96% of the season is still up for grabs on Monday morning.
Worked Examples: The Full Range of One Sunday
The averages above hide how wide the paths out of Week 1 run. All of these are straight from the game file:
- The 1-0 mirage, twice, identically. The two worst seasons ever posted by opener winners are twins: the 2001 Panthers beat Minnesota 24-13 in Week 1 and then lost fifteen straight to finish 1-15 — and the 2020 Jaguars beat Indianapolis 27-20 in Week 1 and then lost fifteen straight to finish 1-15. Two franchises, nineteen years apart, the exact same W-then-15-L season shape.
- The 0-1 champion is routine. Nine of the 27 Super Bowl winners in this file — exactly a third — lost their opener, including the 2001, 2003, and 2014 Patriots, the 2007 and 2011 Giants, the 2020 Buccaneers, and the 2023 Chiefs. The 2003 Patriots are the flagship: blown out 31-0 in Buffalo in Week 1, they finished 14-2 and won the title.
- The most recent season ran the full experiment. In 2025, five of the fourteen playoff teams started 0-1 — and both Super Bowl participants were among them. New England lost its opener 20-13 to Las Vegas and Seattle lost its opener 17-13 to San Francisco; both finished 14-3, and Seattle beat New England 29-13 in the Super Bowl. The two best teams of the season were, for one week, "in crisis."
None of this makes 0-1 a good omen — the base rates above say it's a modest negative one. The examples exist to calibrate the tails: a 1-0 start co-existed with the worst season in the sample, and an 0-1 start co-existed with the champion, over and over.
Honest Limitations
- Selection, not causation. Nothing here says the opener does anything to a season. Winning Week 1 is a symptom of being good, and being good makes the playoffs. The same two-way street runs through the QB continuity numbers: the scoreboard reveals quality at least as much as it shapes it.
- The record gap is partly bookkeeping. As computed above, 43.1% of the final-record gap is the opener sitting in the record itself. Every "since 1999, 1-0 teams finish…" factoid you see in September has this inflation baked in unless it explicitly excludes game 1.
- Group rates are not team destinies. A 25.3% playoff rate for 0-1 teams is a base rate over 427 very different teams — contenders that stubbed a toe and rebuilders headed to 4-13 alike. Conditioning on anything real (roster, point differential, opponent quality) moves an individual team far off these pooled numbers, and with r² = 3.7% the opener leaves almost all of the outcome unexplained.
- Definitions. Ties count as half a win throughout (that's how ".567" and "double-digit wins" are computed); the six tied openers sit outside the won/lost split. "Opener" means each team's first played regular-season game — for 5 of 861 team-seasons (scheduling quirks and postponements: 1999 Chargers, 2000 Bengals, 2001 Cardinals, 2017 Dolphins and Buccaneers) that game fell in Week 2.
- Eras are pooled. The sample mixes 16- and 17-game schedules and 12- and 14-team playoff fields (the base playoff rate of 39.0% blends both formats). The gap direction is stable across eras, but exact rates would shift a point or two under any single format.
How to Actually Use This
- Update a little, not a lot. The honest read of an 0-1 start is roughly "playoff odds just went from the high-30s to the mid-20s, absent other information." That's real and worth pricing — it is not "season over." A quarter of 0-1 teams make it anyway, and a third of the last 27 champions started there.
- Give Week 1 zero bonus weight. The placebo table is the whole lesson: the opener is one game's worth of evidence, delivered by the season's rustiest football. Treat a September loss exactly like an October loss — and remember most of what you learned may be about the opponent.
- Audit every "teams that start 1-0…" stat for the mechanical trap. If the split quotes final records, about one win of the 2.3-win gap is the opener itself sitting in the record. Rest-of-season splits (.539 vs .463) are the honest version.
- Expect the market to have priced this. A 2.3-win average gap sounds tradable, but it's a pooled description of the past, not an edge — the same reason point differential beats raw records for prediction: records (and starts) are noisy readouts of quality, and everyone can see them.
Related machinery on this site: scoring by week (what else is weird about Week 1 football), Pythagorean wins (the better way to read a record of any length), QB continuity (the same symptom-vs-cause trap at season scale), and one-score games (why any single NFL result carries so much noise in the first place).
Reproduce It
One public file: games.csv from nflverse nfldata, bundled at /data/games.csv. Build one row per team-game from played regular-season games, flag each team's first game of the season, and aggregate. Playoff appearance means the team shows up in any postseason row (game_type of WC/DIV/CON/SB) that season. The chart and the full console breakdown come from explainer_src/make_week1_chart.py; the core is a dozen lines of pandas:
import pandas as pd, numpy as np

df = pd.read_csv("https://nflanalytic.com/data/games.csv")
reg = df.dropna(subset=["home_score", "away_score"])
reg = reg[reg.game_type == "REG"]                    # 6,967 games, 1999-2025

h = reg.rename(columns={"home_team": "team", "home_score": "pf", "away_score": "pa"})
a = reg.rename(columns={"away_team": "team", "away_score": "pf", "home_score": "pa"})
cols = ["season", "week", "gameday", "team", "pf", "pa"]
tg = pd.concat([h[cols], a[cols]])
tg["w"] = np.where(tg.pf > tg.pa, 1.0, np.where(tg.pf == tg.pa, 0.5, 0.0))
tg = tg.sort_values(["season", "team", "gameday", "week"])
tg["g"] = tg.groupby(["season", "team"]).cumcount() + 1      # 1 = opener

ts = tg.groupby(["season", "team"]).agg(games=("w", "size"), pts=("w", "sum"))
ts["opener"] = tg[tg.g == 1].set_index(["season", "team"])["w"]
ts["final"] = ts.pts / ts.games                      # ties as half a win
ts["rest"] = (ts.pts - ts.opener) / (ts.games - 1)

won, lost = ts[ts.opener == 1.0], ts[ts.opener == 0.0]
print(len(won), len(lost))                           # 428 427
print(won.final.mean(), lost.final.mean())           # .5673 .4348
print(won.rest.mean(), lost.rest.mean())             # .5388 .4634
print((won.final > .5).mean(), (lost.final > .5).mean())  # .605 .316
print(np.corrcoef(ts.opener, ts.rest)[0, 1])         # +0.192
All figures on this page were computed 2026-07-23 on the 1999–2025 file (861 team-seasons; the 2026 schedule rows carry no scores yet and drop out of the played-games filter). Numbers will shift slightly as future seasons append.
Data: nflverse/nfldata, public. Playoff fields were 12 teams through 2019 and 14 from 2020; ties count as half a win; the six tied openers (2018 Steelers–Browns, 2019 Cardinals–Lions, 2022 Texans–Colts) are excluded from the won/lost split.
Your team
Kept in this browser only.
Pick the playoffs
Pick the games left and see both conferences’ seeds under the NFL’s tie-breakers.
Go deeper
Want the code behind these metrics? Work through the 43-chapter NFL analytics tutorial.
Browse tutorials Free tools