The finding: the NFL really is higher-scoring than it used to be
"Scoring is up" is one of those claims everyone repeats and nobody checks. So I pulled the complete nflverse game log bundled with this site — every played game from 1999 through 2025 — and measured the combined final score, season by season. The trend is real and substantial: average total points per game climbed from about 41.7 in 1999 to 46.0 in 2025, a gain of roughly four points a game. And the single highest-scoring season in the entire window is the one you'd guess if you remember it: the empty-stadium 2020 campaign, at a startling 49.5.
The climb wasn't an accident. It tracks two decades of rule changes that systematically tilted the field toward offense — and, as a bonus, it gives us a clean way to check whether the betting market kept up.
The exhibit: 27 seasons of scoring
Here is the average total points per game by season, straight from data_layer/games.csv, with the average closing over/under line overlaid so you can see the market move alongside the scoring.
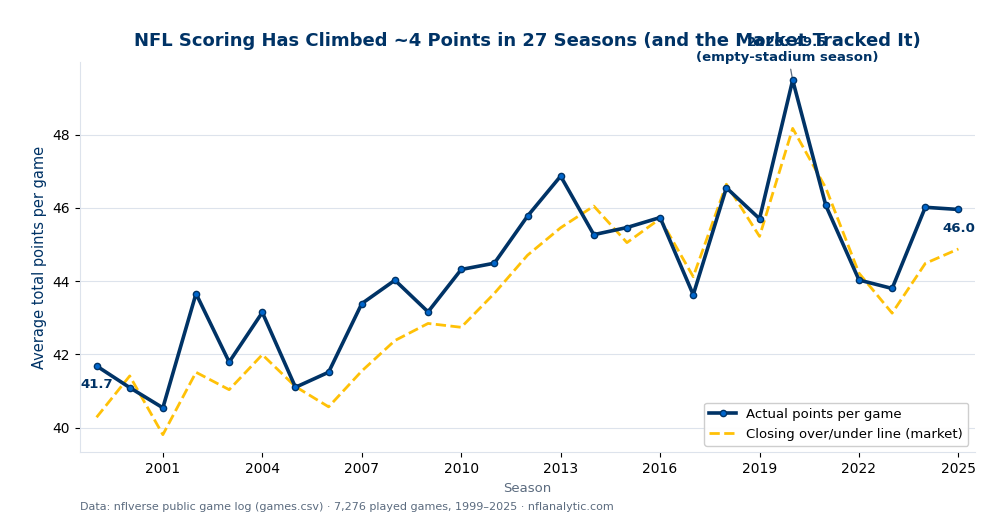
The shape isn't a straight line — it's a staircase with a spike. Scoring drifted up through the 2000s, jumped in the early 2010s, hit a local peak around 2013, dipped in 2017, then spiked to its all-time high in 2020 before settling back into the mid-40s. Each of those moves has a cause, and most of them are written in the rulebook.
What pushed scoring up
The league has spent twenty years making it harder to play defense and easier to throw. The biggest levers:
- Protecting receivers and passers. The 2004 re-emphasis of illegal contact and defensive holding (the "Ty Law rules") freed receivers downfield, and a steady stream of roughing-the-passer and defenseless-receiver protections followed. Throwing the ball got safer and more productive almost every year.
- The passing era and analytics. Offenses learned that passing is more efficient than running on early downs, spread the field, and went for it more on fourth down. The early-2010s jump tracks the leaguewide shift toward pass-first, tempo offense.
- The 2020 anomaly. The pandemic season's 49.5 points per game is the clear outlier. With empty stadiums, a disrupted offseason, and no preseason, defenses were widely worse early and crowd-driven home advantage evaporated. It's the highest-scoring season on record — and the least representative.
Note the recent cooling: after the 2020 spike, scoring dipped to around 44 in 2022–23 before bouncing back near 46. The rule-driven climb is real but not monotonic; defenses adapt, and the line wobbles year to year.
Did the betting market keep up?
Overlaying the average closing over/under gives a free check on market efficiency. The answer: the market tracked the rise closely — the amber line shadows the scoring almost everywhere — but it ran slightly low. Across all seasons, actual scoring averaged about 0.7 points above the closing total. That's a small, consistent lag: as scoring trended up, the market's totals were a touch behind the climb, so the "over" cashed marginally more often than the "under" over this stretch.
Don't mistake that for a betting edge. A 0.7-point average gap is well inside the vig, it's a backward-looking artifact of a rising trend (the market can only price what it has seen), and it says nothing about any single game. It's the same lesson as the point spread: the market is an excellent, nearly-unbiased estimate that still leaves no free money once the house takes its cut.
A worked example: reading the 2020 spike
Take the peak. In 2020 the average game produced 49.5 combined points — roughly 8 points more than 1999 and about 3.5 above the surrounding seasons. If you'd bet "the over" blindly on every 2020 game expecting the usual mid-40s, you'd have been right more often than not, because the market hadn't priced an empty-stadium scoring surge it had never seen. Then 2021–22 regressed hard as crowds returned and defenses caught up, and the edge vanished. That round trip — a shock the market lagged, then corrected — is exactly how an efficient market absorbs a one-off: late, then fully.
Honest limitations
- Total points is a blunt measure. Combined score blends offense, defense, special teams, pace, and turnovers. A rise could come from more efficient offense, faster play (more possessions), worse defense, or kicking — the trend line can't separate them. It tells you scoring rose, not precisely why.
- Rule-change attribution is interpretive. I've matched the bumps to well-documented rule changes, but seasons move for many overlapping reasons (weather, talent cycles, scheme trends). Treat the causes as the consensus explanation, not a proof.
- The market line isn't perfectly comparable. Closing totals reflect everything known at kickoff, including weather and injuries; comparing a season's average line to its average score is a fair sanity check but not a rigorous test of market efficiency.
- 2020 is a genuine outlier. The empty-stadium season distorts any trend that includes it. The underlying climb is clear with or without 2020, but that single point should be read as an asterisk, not a data point on the curve.
Reproduce it
This is one CSV and a group-by. Load data_layer/games.csv, keep rows with a real total, and average total (and total_line) by season. The chart is produced by explainer_src/make_scoring_trend_chart.py, which reads the bundled nflverse log directly and stamps a "Data: nflverse" footer onto the exhibit. No network, nothing hand-entered.
Further reading
- How accurate is the point spread? — the same market-efficiency logic applied to spreads instead of totals.
- Weather and NFL scoring — what suppresses scoring within a season, where wind matters and cold doesn't.
- Home-field advantage is shrinking — another 27-season trend read straight from the game log.
Go deeper
Want the code behind these metrics? Work through the 45-chapter NFL analytics tutorial.
Browse tutorials Free tools