The Finding: A Pick'em Favorite Is Barely Better Than a Coin Flip
The point spread is the market's best guess at a game, so it's worth asking a simple question of it: when Vegas installs a favorite, how often does that favorite simply win — straight up, scoreboard only, forget the spread? I pulled the complete nflverse game log bundled with this site — regular-season games from 1999 through 2025 — and bucketed every game by the size of the spread. The relationship is clean and steep: a near-pick'em favorite wins only 53.2% of the time, a touchdown favorite wins 73.1%, and only double-digit favorites approach a sure thing — yet even 12+ point favorites lose about one game in nine.
The Exhibit: Favorite Win% by Spread Size
Each bar is the favorite's straight-up win rate for that range of spreads, with the sample size beneath it. The dotted line is the 50% coin flip you'd get if being favored meant nothing.
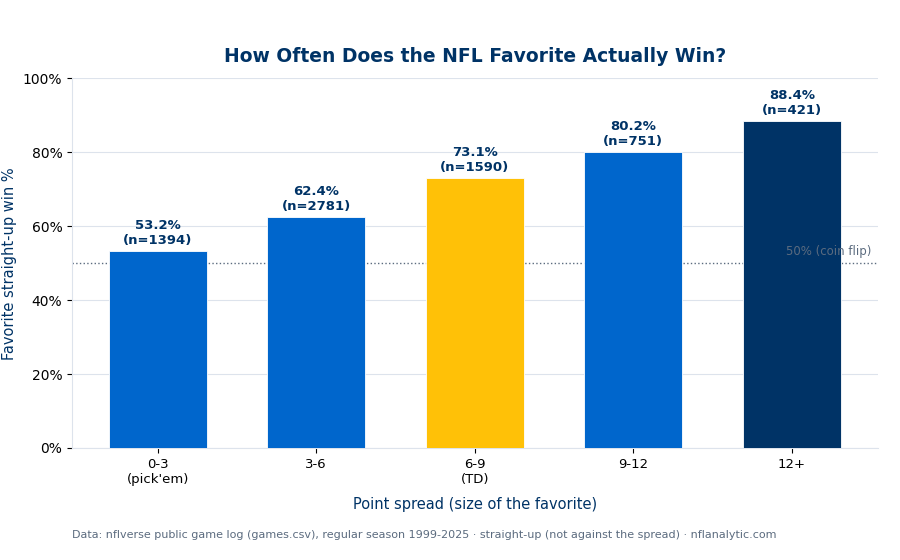
Read it left to right and the spread earns its keep: 53.2% → 62.4% → 73.1% → 80.2% → 88.4%, climbing in lockstep with the number. The samples are large at the common spreads (nearly 2,800 games in the 3–6 bucket) and thinner at the extremes (421 games at 12+), so the small-spread figures are rock solid and the blowout-favorite figure is directional. The shape is exactly what a well-calibrated market should produce.
Straight Up vs. Against the Spread — Don't Confuse Them
This is the distinction that trips people up. Straight up asks only “did the favorite win the game?” Against the spread asks “did the favorite win by more than the number?” They're completely different questions with completely different answers. A 10-point favorite that wins by 3 went 1-0 straight up and 0-1 against the spread. This chart is entirely the first kind — it measures whether favorites win, not whether they cover. As we cover in how accurate the point spread is, covering hovers near 50% by design (that's what makes the market efficient); winning straight up, by contrast, climbs steadily with the spread, because the spread is the market's estimate of how much better the favorite is.
Why the curve rises but covering doesn't
The spread is set so that betting either side is roughly a coin flip — so cover rate stays near 50% across the board. But a bigger spread genuinely reflects a bigger talent gap, so the straight-up win rate climbs. Calibration of the spread and a rising win curve are two sides of the same efficient market.
What It Means for Reading a Game
The practical lesson is to calibrate your confidence to the number, not to the word “favorite.” A 2.5-point favorite is favored in name only — the game is essentially a coin flip, and treating it as a likely win is a mistake the standings punish every week. A touchdown favorite is a genuine but beatable favorite (27% lose). Only when the spread reaches double digits is the outcome close to decided — and even then, the NFL's parity means roughly one in nine of those games still ends in an upset. The next time you hear “they're favored, they should win,” the honest follow-up is “by how much?”
Caveats and Limits
The dataset's spread is one snapshot; lines move during the week. A game's bucket reflects that recorded number, which may differ slightly from the opener or the number at kickoff.
The 12+ bucket has 421 games versus thousands at smaller spreads. The 88% figure is directionally solid but will wobble more than the pick'em and field-goal-favorite numbers.
Playoff games are excluded here; postseason favorites and seeding dynamics behave differently (see our playoff breakdown).
Knowing favorites win 73% at a touchdown isn't a moneyline edge — the price already reflects it. This describes outcomes, not profit.
The bottom line
Across 1999–2025, NFL favorites won straight up 53% of the time as pick'ems, 73% as touchdown favorites, and 88% as double-digit favorites — a steady climb that shows the spread is a well-calibrated estimate of the gap between two teams. But the headline for any single game is humility: until the number gets large, “favored” is a long way from “safe,” and even the biggest favorites lose often enough to keep the league honest. Respect the size of the spread, not just the label.
Further reading
- Free textbook: Chapter 22: Betting Market Analysis — how spreads, totals, and prices are built, at DataField.dev.
- How Accurate Is the Point Spread? — the against-the-spread companion to this piece
- Key Numbers — why 3 and 7 dominate NFL margins
- Playoff Football, by the Numbers — how favorites and home teams fare in January
- Pro-Football-Reference — game results and historical lines
Go deeper
Want the code behind these metrics? Work through the 45-chapter NFL analytics tutorial.
Browse tutorials Free tools