The finding: overtime is rare, and the 2017 rule made ties less rare
NFL overtime feels like a coin flip with the game on the line — and the rules around it have quietly changed twice in the last decade. I pulled the complete nflverse game log bundled with this site — 7,276 played games from 1999 through 2025 — to answer the basic questions with data instead of memory. Overtime is uncommon: just 6.1% of games reach it. But the most interesting finding is a clean rule effect. When the league shortened overtime from 15 minutes to 10 in 2017, the share of overtime games ending in a tie more than doubled — from 2.3% of OT games before the change to 5.7% after. Less time to settle it means more games that never get settled.
The exhibit: before and after the 10-minute rule
Split the 27 seasons at 2017 and compare the two eras on two things: how often games reach overtime, and what share of those overtime games end tied.
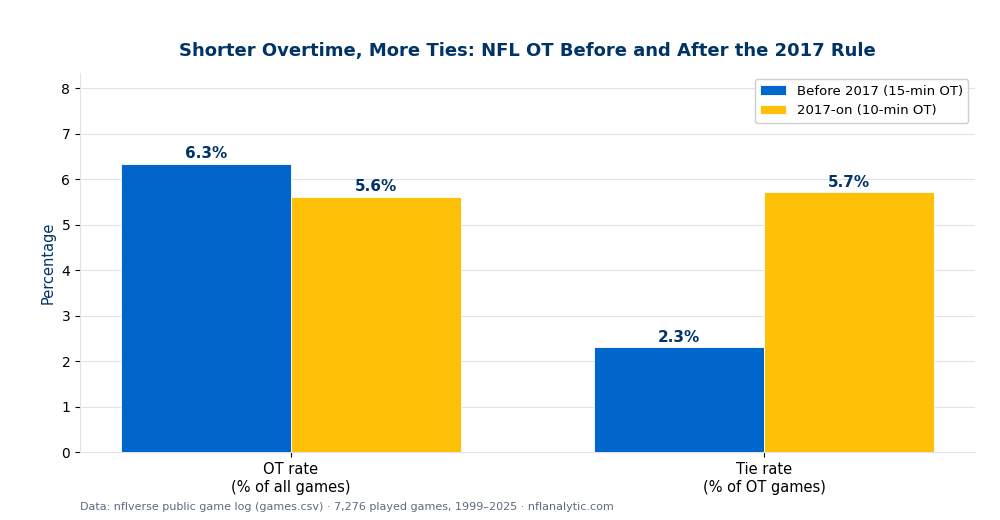
Both moves point the same way and have the same cause: a shorter overtime. With only 10 minutes instead of 15, there's less time for a second possession and a winning score, so a few more games that would once have been decided now expire level. The dip in the overall OT rate is smaller and noisier, but the tie effect is unmistakable.
Home-field advantage fades a little in overtime
Home teams win 56.5% of games decided in regulation but only 54.9% of overtime games (excluding ties). It's a modest drop, not a collapse — but it lines up with intuition. By the time a game reaches overtime it was, almost by definition, a coin-flip-close contest, and the extra session is a small, high-variance sample where the crowd and the comforts of home have less room to assert themselves. Overtime is where home-field advantage, real as it is across a full season, matters least.
A worked example: why ties cluster after 2017
Put numbers on the rule change. Before 2017, an overtime period was 15 minutes — usually enough for both teams to possess the ball and for someone to reach the end zone or kick a winner. After 2017, with 10 minutes, a single long opening drive can eat much of the period, leaving the other team little or no time to answer; if the first drive stalls and the clock runs out, the game ties. Across roughly 2,500 games in the 10-minute era, that produced 8 ties out of about 140 overtime games — 5.7% — versus 7 ties out of about 300 overtime games (2.3%) across the 4,800 games of the 15-minute era. Same sport, same overtime coin flip; a five-minute rule change roughly doubled the odds nobody wins.
Honest limitations
- Small subsamples. Overtime games are only 6% of the schedule, and ties are a handful within that — 15 ties in 27 years. The doubling of the tie share is a real and sensible effect, but it rests on small counts, so don't read the exact percentages as precise.
- This is regular-season overtime. The data is overwhelmingly regular-season games, where OT can end in a tie. Playoff overtime never ties (it plays until someone scores) and uses different rules, including the 2022 change guaranteeing both teams a possession. Those postseason games aren't separated out here.
- Multiple rule changes overlap. The 2017 shortening isn't the only tweak to overtime in this window, and the league's broader scoring environment shifted too. I've attributed the tie effect to the clock because the mechanism is direct, but seasons move for many reasons.
- "Overtime" is a binary flag. The game log marks whether a game went to OT, not how it was won (touchdown, field goal, defensive score) or how many possessions it took. A deeper study would use play-by-play; this is the game-level picture.
Reproduce it
Load data_layer/games.csv, keep played games, split on season at 2017, and compute the share with overtime == 1 and, among those, the share with result == 0 (a tie). The chart is produced by explainer_src/make_overtime_chart.py, which reads the bundled nflverse log directly and stamps a "Data: nflverse" footer. No network, nothing hand-entered.
Further reading
- Free textbook: Chapter 22: Betting Market Analysis — the theory behind this, at DataField.dev.
- Home-field advantage is shrinking — the season-long edge that fades in the overtime coin flip.
- How accurate is the point spread? — why games this close are nearly impossible to call in advance.
- Is the NFL higher-scoring than it used to be? — another 27-season trend read straight from the game log.
Go deeper
Want the code behind these metrics? Work through the 45-chapter NFL analytics tutorial.
Browse tutorials Free tools