The finding: scoring peaks early and fades through the autumn
NFL scoring is not flat across the calendar. It is highest in the warm, early weeks, and it drifts downward as the season grinds into the cold. We averaged the combined final score — home points plus away points — for every regular-season game in the bundled nflverse game log, 1999 through 2025, and grouped the games by week of the season. The shape is small but orderly: scoring climbs to an early peak, then declines steadily into late November before flattening out. Across the whole era the average game produces 44.2 total points, but that average hides a seasonal arc.
The high point comes in Week 5, where games average 45.4 points — offenses are in rhythm, the weather is still warm, and the season has not yet turned. The low point arrives in Week 11, deep in mid-to-late November, at 42.75 points — the coldest, windiest stretch of the schedule, with defenses now holding half a season of film on every offense. The full swing from peak to trough is about 2.6 points per game: modest, but consistent and pointed in one direction.
The exhibit: points per game by week
Here is the average total points per game for each week of the regular season, straight from data_layer/games.csv. The line rises to its Week 5 peak, then steps down through the autumn.
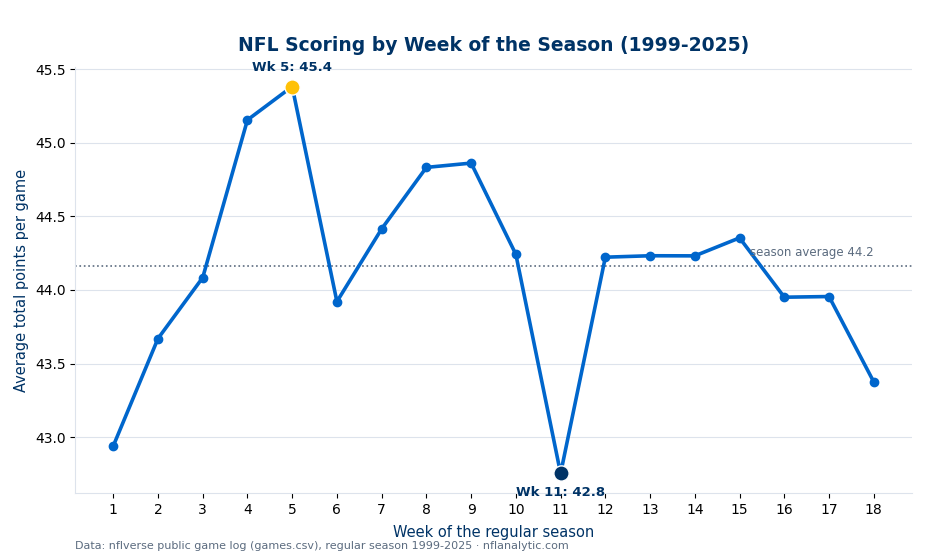
Read the line left to right and the season tells a story. It opens a touch low in Week 1 (42.9), climbs into the warm-weather weeks to top out at Week 5 (45.4), holds high through the rest of October, then slides into the November cold to bottom out at Week 11 (42.75). It firms up again into December but never recaptures the early-season heights, and the finale in Week 18 (43.4) sits below the season average. The arc is gentle — the whole range is about a field goal — but it leans the same way every time: high in the early autumn, lower as the weather turns.
The numbers behind the arc
Why each landmark looks the way it does
The interesting part is not that the line moves — it is that each turning point has a plain football reason behind it. Walk the four landmarks in order.
Week 1 (42.9) — rust. The modern preseason gives starters very few real reps. Quarterbacks and their receivers open the year on timing that has not been fully game-tested, the play sheet is conservative, and penalties run high while everyone shakes off the offseason. Early-season offense is a half-step behind its own defense, and the scoreboard reflects it.
Week 5 (45.4) — the peak. By the start of October offenses have found their rhythm — the install is in, the chemistry is live — while the weather is still warm and the wind still calm. Defenses have not yet built a full book of film on what each offense likes to do. Skilled offense in mild conditions is the highest-scoring environment the schedule offers, and it lands right here.
Week 11 (42.75) — the trough. Mid-to-late November is the coldest, windiest, shortest-daylight stretch of the regular season, and wind in particular shaves points off the deep ball and the kicking game. At the same time defenses now hold half a season of tape on every opponent and can take away first reads. Tougher conditions and better-prepared defenses pull in the same direction, and scoring bottoms out.
The fourth landmark, Week 18 (43.4), has a different cause. The finale sits low partly because of the weather but mostly because of who is on the field: teams with playoff seeding locked in often rest their starters, so a chunk of Week 18 snaps go to backups against backups. It is also the youngest, smallest sample on the chart — Week 18 has existed only since the 17-game schedule arrived in 2021, so it rests on roughly 80 team-weeks rather than the deep history behind the early weeks. Read it as suggestive, not settled.
The same story as the weather
If the autumn decline feels familiar, it should — it is the seasonal face of the weather effect read from the other side. Our weather-and-scoring piece found that cold barely moves NFL scoring but wind moves it a lot, and that the windiest games sit several points below the calmest. The weekly arc here is what that looks like when you plot it against the calendar instead of the forecast: the schedule marches from the warm, calm early autumn into the windy, cold November weeks, and scoring follows. The likeliest single driver of the Week 11 trough is exactly the weather that piles up in mid-November. The schedule is, in part, a slow-motion weather chart.
Honest limitations
This averages 1999 through 2025, and scoring has risen markedly over that span as rules and offenses have changed. The weekly shape is layered on top of a rising long-run trend — the early weeks are not high because of some fixed law, and the curve mixes seasons that scored very differently. See the scoring-trend piece for that rise.
The finale has only existed since the 17-game schedule began in 2021, so it rests on far fewer weeks than the rest of the chart (about 80 team-weeks). Its low value is real in this window but carries much wider uncertainty than the early-season points beside it.
The full peak-to-trough swing is about 2.6 points — a clear signal pooled across 27 seasons, but small next to the game-to-game scatter. A single season’s weekly line is noisy enough that the arc can disappear or invert in any one year. The pattern lives in the average, not in any one Sunday.
Week number is a stand-in for several things that move together — weather, where offenses are in their development, how much film defenses hold, and late-season resting. Those drivers blur into one another and cannot be separated by a weekly average. This is correlation and seasonality, not a controlled test of any single cause.
Reproduce it
Every number here is one CSV and a group-by. Load data_layer/games.csv, keep the regular-season (REG) games, add home_score and away_score into a combined total, group by week, and take the mean of that total in each week. The Week 5 peak, the Week 11 trough, and the 44.2 season average fall straight out. The chart is produced by explainer_src/make_scoring_by_week_chart.py, which reads the bundled nflverse log directly and stamps a “Data: nflverse” footer onto the exhibit — no network calls, nothing hand-entered.
Further reading
- Free textbook: Chapter 14: Situational Football — the theory behind this, at DataField.dev.
- Weather and scoring — why wind, more than cold, drives the November dip the weekly arc traces.
- How scoring has risen — the long-run trend this weekly shape sits on top of.
- Rest and scheduling — how the calendar and rested starters shape what shows up on the field.
- The most common final scores — where all these points actually land when the game ends.
- Pro Football Reference — box scores and weekly results for every game in the database.
Go deeper
Want the code behind these metrics? Work through the 45-chapter NFL analytics tutorial.
Browse tutorials Free tools