The Question: Whose 2026 Schedule Is Hardest — and Should You Even Care?
Every July, every season preview runs the same table: rank the 32 teams by their opponents' combined record from last season and call it strength of schedule. This page runs the ritual properly — the full 2026 table, computed from the schedule and the 2025 results in the nflverse game file — and then does the thing preview articles never do: it grades the method. For every season from 2003 to 2025, we built the same preseason forecast and compared it with the schedule each team actually ended up playing. Half of this page is the table; the other half is how wrong that table usually is.
Definitions, so every number is checkable: a team's preseason SOS is the per-game average of its scheduled opponents' previous-season regular-season winning percentage (ties count half; division rivals count twice because you play them twice). Its actual SOS is the same average using what those opponents did that season. Relocated franchises are mapped through their moves — SD→LAC, STL→LA, OAK→LV — so a franchise's prior-year record follows it. The study starts in 2003 because 2002 (realignment, Houston's arrival) is the first season with all 32 teams on the books.
The Exhibit: The 2026 Table, and 23 Years of Receipts
Left panel: every team-season 2003–2025, preseason SOS against actual SOS. If the forecast worked, the cloud would hug the diagonal. It doesn't — the fitted line is nearly flat. Right panel: the 2026 forecast this method produces, hardest to easiest.
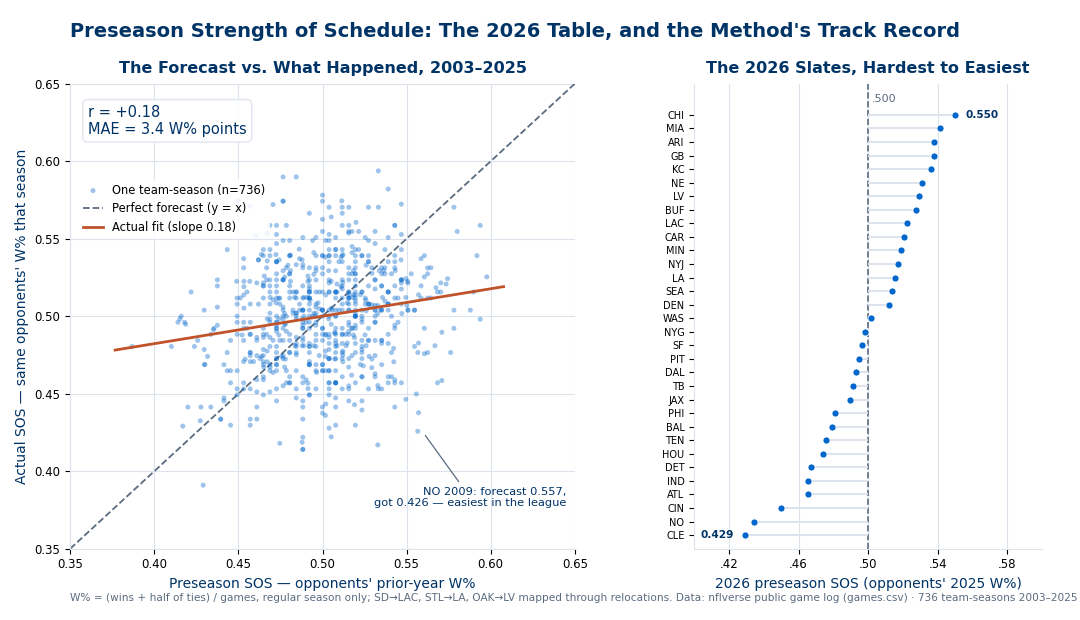
The full 2026 table — each team's 17 opponents' combined 2025 regular-season record (every opponent's full record counted once per meeting, 289 opponent-games per team):
| # | Team | Division | Opponents' 2025 | Opp W% |
|---|---|---|---|---|
| 1 | CHI | NFC North | 158-129-2 | .550 |
| 2 | MIA | AFC East | 156-132-1 | .542 |
| 3 | GB | NFC North | 155-133-1 | .538 |
| 3 | ARI | NFC West | 155-133-1 | .538 |
| 5 | KC | AFC West | 155-134 | .536 |
| 6 | NE | AFC East | 153-135-1 | .531 |
| 7 | LV | AFC West | 153-136 | .529 |
| 8 | BUF | AFC East | 152-136-1 | .528 |
| 9 | LAC | AFC West | 151-138 | .522 |
| 10 | CAR | NFC South | 150-138-1 | .521 |
| 11 | MIN | NFC North | 149-138-2 | .519 |
| 12 | NYJ | AFC East | 149-139-1 | .517 |
| 13 | LA | NFC West | 148-139-2 | .516 |
| 14 | SEA | NFC West | 148-140-1 | .514 |
| 15 | DEN | AFC West | 148-141 | .512 |
| 16 | WAS | NFC East | 144-143-2 | .502 |
| 17 | NYG | NFC East | 143-144-2 | .498 |
| 18 | SF | NFC West | 143-145-1 | .497 |
| 19 | PIT | AFC North | 143-146 | .495 |
| 20 | DAL | NFC East | 142-146-1 | .493 |
| 21 | TB | NFC South | 141-146-2 | .491 |
| 22 | JAX | AFC South | 141-147-1 | .490 |
| 23 | PHI | NFC East | 138-149-2 | .481 |
| 24 | BAL | AFC North | 138-150-1 | .479 |
| 25 | TEN | AFC South | 137-151-1 | .476 |
| 26 | HOU | AFC South | 136-151-2 | .474 |
| 27 | DET | NFC North | 134-153-2 | .467 |
| 28 | ATL | NFC South | 134-154-1 | .465 |
| 28 | IND | AFC South | 134-154-1 | .465 |
| 30 | CIN | AFC North | 130-159 | .450 |
| 31 | NO | NFC South | 125-163-1 | .434 |
| 32 | CLE | AFC North | 124-165 | .429 |
The hardest five: Chicago (.550), Miami (.542), Green Bay and Arizona (tied at .538 on identical 155-133-1 opponent records), and Kansas City (.536). The easiest five: Cleveland (.429), New Orleans (.434), Cincinnati (.450), and Atlanta and Indianapolis (tied at .465). Top to bottom that's a gap of .121 — about 2.1 wins of opponent strength over 17 games — and, for what it's worth, a perfectly typical gap: the 2003–2025 forecasts averaged a .119 spread.
The division pattern is the schedule formula showing through. Division mates share 14 of 17 opponents, so slates cluster: the AFC East averages .529 (all four teams sit in the top 12), the AFC West .525, the NFC North .519 — while the AFC North averages just .463, with Cincinnati 30th and Cleveland 32nd. The rotations explain it. The AFC East drew the AFC West and the NFC North — the latter the only division whose four teams all finished 2025 above .500. The AFC North drew the AFC South and the NFC South, where nobody finished above .500 at all. Kansas City is the pattern in miniature: its cross-division draws alone (AFC East plus NFC West) include five teams that won 12 or more games in 2025. And within a division, the three place-based games still separate neighbors by a lot — Carolina (.521) sits 8.7 points of W% above New Orleans (.434), and Chicago (.550) 8.3 above Detroit (.467).
One schedule footnote straight from the file: the 2026 season opens on a Wednesday — September 9, New England at Seattle, 8:20 pm, Week 1 — a matchup of two teams that went 14-3 last season. Week 1 then runs through Thursday (SF at LA), thirteen Sunday games, and a Monday nighter on September 14. We report the Wednesday date as a fact of the schedule file and leave it at that.
Worked Example: Chicago's 17, Game by Game
What does a .550 schedule actually look like? Here is the entire Bears slate, with each opponent's 2025 record:
| Wk | Opponent | Opp 2025 | W% | Wk | Opponent | Opp 2025 | W% |
|---|---|---|---|---|---|---|---|
| 1 | at CAR | 8-9 | .471 | 11 | vs NO | 6-11 | .353 |
| 2 | vs MIN† | 9-8 | .529 | 12 | at DET† | 9-8 | .529 |
| 3 | vs PHI | 11-6 | .647 | 13 | vs JAX | 13-4 | .765 |
| 4 | vs NYJ | 3-14 | .176 | 14 | at MIA | 7-10 | .412 |
| 5 | at GB† | 9-7-1 | .559 | 15 | at BUF | 12-5 | .706 |
| 6 | at ATL | 8-9 | .471 | 16 | vs GB† | 9-7-1 | .559 |
| 7 | vs NE | 14-3 | .824 | 17 | vs DET† | 9-8 | .529 |
| 8 | at SEA | 14-3 | .824 | 18 | at MIN† | 9-8 | .529 |
| 9 | vs TB | 8-9 | .471 | Week 10: bye. † = division game. | |||
Eleven of the seventeen games are against teams that finished 2025 above .500, including back-to-back dates with two of 2025's three 14-3 teams — New England in Week 7, then straight to Seattle in Week 8. The structural culprit is success itself: Chicago posted the NFC North's best 2025 record (11-6), and the three place-based games a first-place finish buys are Philadelphia (11-6), Seattle (14-3), and Jacksonville (13-4) — each of them the best 2025 record in its own division. Add a division where everyone else also finished over .500 and you get a slate harder than 93.5% of the 736 forecasts in our study window.
And here is the first dose of the medicine this page exists to administer: history says don't take .550 literally. Feed the 23-year regression the Bears' forecast and it projects an actual schedule around .509; feed it Cleveland's .429 and it projects .487. The scary two-win gap between the league's hardest and easiest paper schedules shrinks, on the historical evidence, to about a third of a win.
The Track Record: 23 Seasons of Grading the Forecast
Now the audit. For each season 2003–2025 we computed every team's preseason SOS from prior-year records, then the same opponents' actual W% that season — 736 team-seasons. If preseason SOS were informative, the two would correlate strongly. The pooled correlation is r = +0.18. Squared, that's 0.033: the July number explains about 3% of the variance in the schedule difficulty teams actually experienced. The average absolute miss is 3.45 points of W% (median 2.84), and 26% of all team-seasons missed by more than 5 points — the equivalent of every opponent on the slate being about 0.6 wins per 17 games stronger or weaker than advertised.
| Season | r | MAE (pp) | Forecast-hardest | Actual SOS rank |
|---|---|---|---|---|
| 2003 | +0.21 | 3.70 | DAL | 26th |
| 2004 | +0.11 | 3.03 | MIA | 3rd |
| 2005 | +0.12 | 3.34 | MIA | 27th |
| 2006 | +0.23 | 3.34 | CIN | 5th |
| 2007 | +0.16 | 2.88 | BUF | 8th |
| 2008 | +0.41 | 3.75 | PIT | 7th |
| 2009 | +0.43 | 4.25 | MIA | 1st |
| 2010 | +0.31 | 3.37 | HOU | 8th |
| 2011 | +0.22 | 2.91 | CAR | 14th |
| 2012 | +0.06 | 2.99 | NYG | 6th |
| 2013 | +0.05 | 3.41 | CAR | 17th |
| 2014 | +0.66 | 2.61 | LV* | 1st |
| 2015 | +0.41 | 3.85 | PIT | 14th |
| 2016 | −0.22 | 3.87 | ATL | 25th |
| 2017 | +0.29 | 3.91 | DEN | 18th |
| 2018 | −0.17 | 2.91 | GB | 19th |
| 2019 | +0.06 | 2.50 | LV* | 24th |
| 2020 | +0.37 | 3.27 | NE | 11th |
| 2021 | +0.47 | 2.41 | PIT | 7th |
| 2022 | −0.35 | 4.23 | LA | 11th |
| 2023 | +0.13 | 4.08 | PHI | 21st |
| 2024 | +0.11 | 3.20 | CLE | 5th |
| 2025 | −0.16 | 5.46 | NYG | 8th |
Franchise codes shown as current throughout (SD→LAC, STL→LA, OAK→LV); the starred LV rows are the Oakland-era Raiders. Bold = forecast-hardest team actually finished top-5.
Read the season column honestly and the method looks even shakier than the pooled number. Per-season r swings from +0.66 in 2014 to −0.35 in 2022, and in 4 of the 23 seasons (2016, 2018, 2022, 2025) the correlation was negative — the "hard" schedules were mildly more likely to turn out easy. The team with the forecast-hardest schedule finished with a top-5 actual schedule 5 times in 23 seasons (22%), and finished №1 exactly twice — the 2009 Dolphins and the 2014 Raiders. The mirror stat matches: the forecast-easiest schedule landed bottom-5 in reality also just 5 of 23 times. And the most recent data point is the worst in the window: 2025 posted the study's highest error (MAE 5.46 points) and a negative correlation — the very vintage of results the 2026 table above is built from.
Two mechanisms behind the fog, both visible in the numbers. First, opponents regress toward .500: fit actual-SOS deviation against forecast deviation and the slope is 0.177 — a slate forecast 10 points of W% above average keeps, on average, well under 2 of them. That's just team-level mean reversion doing its work; year-to-year, a team's own W% correlates with its previous season at only r = +0.33 in this window (the same gravity the Pythagorean-wins explainer is built on). Second — and this is the part people get wrong — the forecast isn't failing because schedules are all the same. Actual per-season SOS spreads average .137, wider than the forecast's .119. Real schedule luck is worth about two wins of opponent quality every season. The July table simply cannot see which teams will get it.
The Misses Worth Remembering
- The biggest miss in 23 years: the 2009 Saints, +13.1 points. New Orleans entered 2009 with the 8th-toughest forecast (.557) and played the league's outright easiest schedule (.426, 32nd of 32). The engine of the collapse sat inside their own division: Tampa Bay, faced twice, fell from 9-7 to 3-13 (worth +4.7 points of the miss by itself), Carolina, also faced twice, from 12-4 to 8-8 (+3.1), Atlanta from 11-5 to 9-7, and single-game opponents Miami (11-5 to 7-9) and Washington (8-8 to 4-12) chipped in the rest. The Saints went 13-3 against that suddenly-soft slate and beat Indianapolis 31-17 in the Super Bowl. July said gauntlet; January said glide path.
- The biggest miss in the other direction: the 2025 Titans, −12.5 points. Tennessee's forecast said 29th-easiest (.450); reality dealt them the hardest actual schedule in the league (.574, 1st of 32). They went 3-14 against it. When you see 2025's record-setting 5.46-point forecast error in the table above, this is its face.
- The forecast's best calls, for fairness. The 2009 Dolphins were handed the window's second-highest forecast (.594) and their opponents delivered: .559, the hardest actual schedule that year. The 2014 Raiders matched it — .578 forecast, .570 actual, both league-hardest. Even the window's toughest forecast behaved reasonably: the 2008 Steelers' .598 (opponents a combined 153-103 in 2007) landed at .525, still 7th-hardest. The method isn't pure noise — it's a faint signal wearing a confident costume.
Honest Limitations
- Prior-year records are a stale proxy for a roster. Between the January that sets the record and the September that plays the schedule sit free agency, the draft, coaching changes, and quarterback health — the single most schedule-warping variable there is (see QB continuity: one-starter seasons win at .575, three-starter seasons at .357). Preseason SOS prices none of it.
- Regression to the mean is baked into the miss. The 0.177 slope above isn't a quirk; it's what happens when you average 17 mean-reverting opponents. A forecast built from shrunken ratings would beat this one before kickoff. Ours deliberately isn't — the point of this page is to grade the number preview articles actually quote.
- W%-based SOS ignores everything about how you meet an opponent. Home or away, off a bye or on a short week, across time zones — none of it is in the number, and the rest-and-scheduling data shows a bye-sized rest edge alone is worth about a field goal. Two identical .550 slates are not identical. (Who actually drew the 2026 byes, short weeks, and rest edges gets its own companion piece.)
- Opponent W% is itself a crude quality measure. A 9-8 team that outscored opponents by 60 is not a 9-8 team that got outscored by 40. Opponent-adjusted ratings like SRS handle this properly — that's the adjusted strength-of-schedule explainer's territory. This page grades the naive version because the naive version is the one in every preview.
- Convention details. Regular-season games only; ties count half (2025 had exactly one: the 40-40 Packers-Cowboys game, which is why some opponent records above carry a "-1"); actual SOS uses opponents' full-season records, including their games against the team in question — the standard combined-record convention. The study pools 16-game (2003–2020) and 17-game (2021+) eras, which W% units make comparable; 2022's cancelled Bills-Bengals game means two teams' W% that year rests on 16 games.
- The 2026 table inherits 2025's noise. Everything in the table up top is downstream of one season of results — a season that just produced the worst SOS forecast in our 23-year window. That is not a reason to trust it more.
How to Actually Use This
- Quote preseason SOS with its error bars. The honest sentence is: "Chicago's schedule projects hardest, plus or minus 3.5 points of W% on average, with a 1-in-4 chance the number is off by more than 5." If a preview quotes the rank without the error, it's quoting the costume, not the signal.
- Shrink before you reason. Multiply any team's SOS deviation from .500 by roughly 0.18. Chicago's .550 becomes ~.509; Cleveland's .429 becomes ~.487. The two-win paper gap between hardest and easiest compresses to about a third of a win — smaller than one bad officiating call's worth of season narrative.
- Trust the extremes, ignore the middle. Chicago's forecast is harder than 93.5% of the 736 we studied and Cleveland's easier than all but 1.9% — calling those "hard" and "easy" is defensible. Ranking №12 against №17 is astrology; the middle of the table is separated by less than the method's median error.
- Expect the schedule story to change by October. The 2009 Saints and 2025 Titans are the same lesson from opposite directions: the schedule you end up playing is revealed, not scheduled. That's also why September "they've played nobody" takes age so badly — the same base-rate humility the Week 1 signal data recommends about openers applies to the slates behind them.
Reproduce It
One public file: games.csv from nflverse nfldata, bundled at /data/games.csv. Build per-team W% by season, average it over each team's scheduled opponents, and compare forecast to outcome. The chart and the full console breakdown come from explainer_src/make_sos_chart.py; the core is about twenty lines of pandas:
import pandas as pd, numpy as np

df = pd.read_csv("https://nflanalytic.com/data/games.csv")
df[["home_team","away_team"]] = df[["home_team","away_team"]].replace(
    {"SD":"LAC","STL":"LA","OAK":"LV"})          # franchise continuity
reg = df[df.game_type == "REG"]

cols = ["season","team","opp","pf","pa"]
h = reg.rename(columns={"home_team":"team","away_team":"opp",
                        "home_score":"pf","away_score":"pa"})
a = reg.rename(columns={"away_team":"team","home_team":"opp",
                        "away_score":"pf","home_score":"pa"})
long = pd.concat([h[cols], a[cols]])

played = long.dropna(subset=["pf"]).copy()       # 2026 rows drop out here
played["win"] = np.where(played.pf > played.pa, 1.0,
                np.where(played.pf < played.pa, 0.0, 0.5))
wpct = played.groupby(["season","team"]).win.mean()   # ties = half a win

def sos(year, ref):
    s = long[long.season == year].copy()
    s["ow"] = s.opp.map(wpct.xs(ref, level="season"))
    return s.groupby("team").ow.mean()

s26 = sos(2026, 2025).sort_values(ascending=False)
print(s26.head(3))    # CHI .5502  MIA .5415  GB .5381
print(s26.tail(3))    # CIN .4498  NO .4343  CLE .4291

pre = pd.concat({y: sos(y, y-1) for y in range(2003, 2026)})
act = pd.concat({y: sos(y, y)   for y in range(2003, 2026)})
print(np.corrcoef(pre, act)[0, 1])           # r = 0.181
print((pre - act).abs().mean() * 100)        # MAE = 3.45 pp
print(np.polyfit(pre - .5, act - .5, 1)[0])  # slope = 0.177
All figures on this page were computed 2026-07-29 from the file's 1999–2025 results plus the 272-game 2026 schedule (which carries no scores and therefore feeds only the opponent lists). The 2026 table will not change; the study numbers will shift slightly as future seasons append.
Data: nflverse/nfldata, public. Preseason SOS = per-game average of opponents' prior-season regular-season W%; actual SOS = same average over the same opponents' current-season W%; study window 2003–2025 (first prior-year baseline with all 32 franchises); SD→LAC, STL→LA, OAK→LV mapped throughout.
Go deeper
Want the code behind these metrics? Work through the 45-chapter NFL analytics tutorial.
Browse tutorials Free tools