The Finding: Bigger Favorites Win More — But They Don't Cover More
Here is one of the cleanest results in football analytics, and it surprises almost everyone the first time they see it. Bigger favorites win games far more often straight up — that part is intuitive. But bigger favorites do not cover the spread more often. We pulled the complete nflverse game log bundled with this site — regular-season games from 1999 through 2025, against the spread, pushes excluded — and bucketed every game by the size of the spread. No matter how lopsided the matchup, the favorite covers right around 50% of the time. A pick'em favorite covers 50.4%; a touchdown favorite covers 49.0%; a 12-point-plus favorite covers 48.4%. Every bucket sits within a couple of points of a coin flip.
The Exhibit: Favorite Cover% by Spread Size
Each bar is the favorite's against-the-spread cover rate for that range of spreads. The dashed line marks 50% — the coin flip you would get if the spread were a perfect price. Read the bars left to right and almost nothing happens: they all sit on the line.
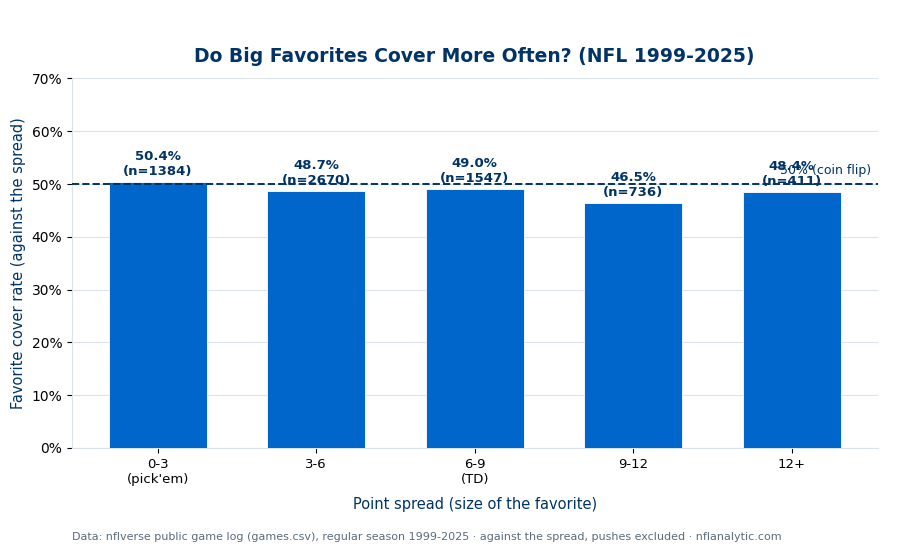
The read is flat: 50.4% → 48.7% → 49.0% → 46.5% → 48.4%, all hovering at or just below 50%. There is no upward slope, no “big favorites are smart money” effect — if anything the buckets sit a hair under the line, a faint echo of the classic favorite-longshot tendency, where the public tends to overback big, well-known favorites and shade their price a touch rich. The samples are large at the common spreads (2,670 games in the 3–6 bucket) and thin at the extremes (411 games at 12+), so treat the 12+ figure as directional. The point is not the exact decimals — it's that every bar lands on the coin-flip line.
Why Cover Rate Stays at 50% While Win Rate Climbs
The reason is the spread itself. A point spread is not a prediction of who will win — it's a price, set by the market so that roughly equal money lands on both sides. A sportsbook does not want to root for either team; it wants balanced action and to collect the vig. So it moves the number until backing the favorite and backing the underdog are equally attractive. The instant that balance is struck, the favorite's chance of covering is forced toward 50% — by construction. It does not matter whether the matchup is even or a total mismatch: the spread simply gets bigger to absorb the mismatch, dragging the cover probability back to the coin-flip line.
The same data, two different questions
Winning and covering are not the same question. Straight up asks “did the favorite win the game?” That rate is free to climb, because a bigger spread genuinely reflects a bigger talent gap — a touchdown favorite wins about 73% of games outright (see the favorite win-rate piece). Against the spread asks “did the favorite win by more than the number?” The spread has already priced in how much better the favorite is, so that rate is pinned near 50%. The two are mirror images of one efficient market.
A concrete case makes it click. Suppose a team is a 10-point favorite and wins the game by 7. On the scoreboard, they won — that's a straight-up victory, and it's exactly why the win-rate curve rises with the spread. But against a 10-point spread, winning by 7 is a loss: they needed to win by 11 to cover, so they went 1–0 straight up and 0–1 against the spread. Multiply that across thousands of games and you get the picture above — favorites pile up outright wins while their cover rate sits stubbornly on the line. The bigger the spread, the more room there is for a comfortable win that still falls short of the number.
Caveats and Limits
These are the spreads recorded in the dataset — closing-ish numbers, one snapshot per game. Lines move all week, so a game's bucket reflects that recorded figure, which may differ slightly from the opener or the number at kickoff.
The 12+ bucket has just 411 games against thousands at smaller spreads. That 48.4% will wobble more than the pick'em and field-goal figures — treat the extreme buckets as directional, not precise.
Don't over-read the exact decimals. Whether a bucket says 48.7% or 50.4%, the message is the same: it's a coin flip. The flatness across spread size is the result, not any single number.
A true 50% cover rate is not profitable — the price and the vig mean you'd need to clear about 52.4% just to break even. This describes how games landed, not a way to beat the market. Pushes are excluded throughout.
How This Fits the Straight-Up Story
This piece is the against-the-spread companion to our straight-up work. In how often favorites win outright, the win curve rises steeply with the spread — from a near coin flip at pick'em to 88% for double-digit favorites. Here, the cover curve does the opposite of rising: it stays flat. Both are true at once, and both follow from the same fact — the spread is a well-calibrated price. Our look at how accurate the point spread is measures that calibration directly, and the reason the cover line never moves traces back to where margins actually land, which is the subject of key numbers and the totals version of the same market story in over/under and totals.
How We Computed It
Favorite cover is computed straight from data_layer/games.csv: for each regular-season game we take spread_line and the final result, mark the favorite as covering when the actual margin beats the spread, drop exact pushes, and bucket by the absolute size of the spread. The chart above is regenerated end to end by explainer_src/make_cover_rate_chart.py, so every bar and sample size here can be reproduced from the bundled data without any external feed.
The bottom line
Across 1999–2025, NFL favorites covered the spread right around 50% of the time no matter how big they were — 50.4% as pick'ems, 49.0% as touchdown favorites, 48.4% as double-digit favorites. That flatness is not a coincidence or a fluke of the sample; it's the spread doing exactly what a price is supposed to do, balancing the two sides until covering becomes a coin flip. Bigger favorites win more, but they don't cover more, because the market already charged them for being better. When someone says the big favorite is “a lock,” the honest reply is: to win, maybe — to cover, it's still a flip.
Further reading
- Free textbook: Chapter 22: Betting Market Analysis — the theory behind this, at DataField.dev.
- How Often Do Favorites Win Outright? — the straight-up companion to this against-the-spread piece
- How Accurate Is the Point Spread? — the market calibration that pins covering at 50%
- Key Numbers — why 3 and 7 dominate NFL margins
- Over/Under and Totals — the same efficient-market logic applied to scoring
- Pro-Football-Reference — game results and historical lines
Go deeper
Want the code behind these metrics? Work through the 45-chapter NFL analytics tutorial.
Browse tutorials Free tools