The finding: turf looks higher-scoring, but that's the dome, not the grass
There is a tidy story that fans and broadcasters like to tell about playing surfaces: artificial turf is a fast, true, predictable track, so offenses fly on it and the points pile up, while natural grass is slower and grabs cleats. The raw numbers seem to back it up. I pulled the complete nflverse game log bundled with this site — 7,276 played games from 1999 through 2025 — and split every game by surface. Turf games average 45.54 total points; grass games average 43.32. A 2.2-point gap looks like a real surface effect.
It mostly isn't. Almost the entire gap is a confound: turf fields are disproportionately installed indoors, and indoor games are higher-scoring for reasons that have nothing to do with the surface. Once you compare grass and turf within the same environment — outdoor-to-outdoor, indoor-to-indoor — the 2.2-point gap collapses to under a point. The surface is a bystander that happened to be standing next to the real cause.
The exhibit: split the comparison by roof
Here is average total points for grass vs turf, first pooled across all games, then within outdoor games only, then within indoor (dome or closed-roof) games only — straight from /data/games.csv.
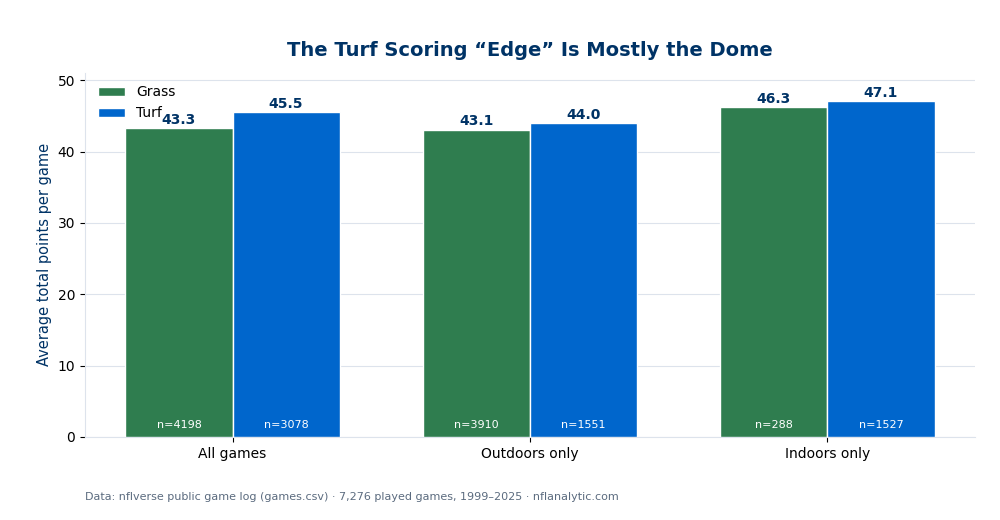
Read the three pairs left to right. Pooled, turf leads by 2.22 points. Restricted to outdoor games, turf leads by just 0.94 (44.04 vs 43.10). Restricted to indoor games, turf leads by 0.80 (47.06 vs 46.26). The moment you stop letting domes hide inside the "turf" column, most of the effect evaporates. What's actually driving the raw gap is the vertical distance between the outdoor pairs (~43–44) and the indoor pairs (~46–47): indoors is worth roughly three points, and turf just happens to sit indoors far more often than grass does.
Why this is a textbook confound
A confounder is a variable that is tied to both the thing you're measuring and the outcome, creating a correlation that isn't causation. Roof type is the classic case here. Dome and retractable-roof stadiums almost all lay artificial turf, because natural grass struggles without direct sunlight and airflow. So "played on turf" is quietly also "more likely played indoors," and indoor games score more — no wind, perfect footing, climate control — exactly the effect documented in the weather and scoring analysis, where domes top every environment at 46.9 points. Attribute the dome's scoring boost to the turf and you've credited the floor for what the ceiling did.
The fix is the one every observational analysis reaches for: hold the confounder fixed and look again. Comparing turf to grass within outdoor games removes the roof from the equation, and comparing within indoor games removes it from the other direction. Both controlled comparisons agree, and both say the surface itself is worth well under a point — small enough that season-to-season noise and which teams play where could account for it entirely.
A worked example: decomposing the 2.2-point gap
You can split the raw 2.22-point advantage into its two pieces. Outdoors, turf beats grass by 0.94 points. Indoors, turf beats grass by 0.80. If the surface were the whole story, the pooled gap would sit near those numbers — around 0.8 to 0.9. Instead it's 2.22, so roughly 1.3 to 1.4 of the 2.2 points come from composition: the turf sample is loaded with high-scoring indoor games (about half of all turf games are indoors, versus a tiny fraction of grass games), which drags the turf average up without any surface effect at all. The genuine surface signal is the ~0.9 point that survives inside a fixed environment — and even that could be teams, not track.
Honest limitations
- Even the controlled gap isn't cleanly causal. Outdoor turf stadiums are not a random sample of outdoor sites — several sit in cold-weather northern cities that build particular kinds of rosters. The surviving ~0.9-point difference could reflect who plays on turf as much as the turf itself. Holding roof fixed removes the biggest confounder, not every confounder.
- Surface labels are coarse and drifting. The file lumps many products — FieldTurf, SportTurf, MatrixTurf, older AstroTurf — under "artificial," and their properties differ. Grass fields vary too, from crowned natural sod to hybrid stitched systems. A binary grass/turf split is a simplification of a spectrum.
- This is about scoring, not safety. The most important surface debate in football is injury risk, especially non-contact lower-body injuries, which many players and studies argue is elevated on turf. None of that is in a game-results file, and nothing here speaks to it. A negligible scoring effect is not a clean bill of health.
- Pooling 27 seasons. Surfaces, rules, and scoring have all shifted since 1999; the aggregate blends eras. The confounding lesson is stable, but the exact point values move year to year.
Reproduce it
Load /data/games.csv, keep rows with a real total, map the surface column to grass vs turf (anything containing "grass" is grass; the rest is artificial), and flag indoor games where roof is dome or closed. Take the mean of total overall, then again within outdoor and within indoor games. The chart and full console breakdown are produced by explainer_src/make_surface_chart.py, which reads the bundled nflverse log directly and stamps a “Data: nflverse” footer. No network, nothing hand-entered.
Further reading
- Chapter 24: Weather Effects, DataField.dev.
- Weather and NFL scoring — the dome effect that drives the raw surface gap, and why wind, not cold, is the real lever.
- The highest- and lowest-scoring NFL stadiums — the same environment story told venue by venue.
- Home-field advantage is shrinking — another effect that is easy to over-attribute if you don't control for what's underneath it.
- How accurate is the point spread? — why even a real, controlled edge in the average scatters wildly game to game.
Go deeper
Want the code behind these metrics? Work through the 43-chapter NFL analytics tutorial.
Browse tutorials Free tools