The finding: the total nails the average and misses every game
The over/under — the bookmaker's line on a game's combined points — gets talked about as if it were either clairvoyant or a trap. It's neither, and it behaves almost exactly like the point spread. I pulled the complete nflverse game log bundled with this site and measured every closing total against the actual combined score across 7,276 games. The result is two numbers that pull in opposite directions. The total is nearly unbiased — the average error is just +0.70 points and the median is exactly zero. And it is wildly wrong about individual games — the standard deviation of that error is 13.4 points, with a mean absolute error of 10.6. The market knows the average; it has almost no idea about any one Sunday.
The exhibit: 7,276 games of total error
Here is the distribution of total error — actual combined points minus the closing over/under — straight from data_layer/games.csv. A perfect line would stack every game on the dotted zero.
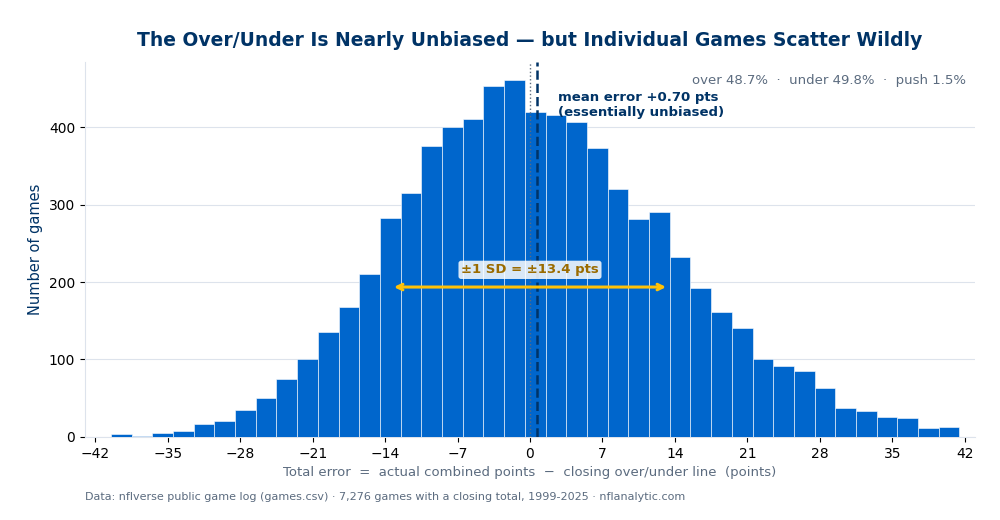
Two features carry the argument. The peak sits on zero and the navy mean line is nearly on top of the dotted perfect-prediction line — that's the lack of bias. And the bell is broad: plenty of games land 20, 30, even 40 points off the number in both directions. A forecast can be perfectly centered and still miss by a touchdown-and-a-half on a typical game, and that is exactly what an NFL total does.
Over or under? Almost exactly a coin flip
The unbiasedness shows up in the hit rates. Across the 7,276 games, the over cashed 48.7% of the time, the under 49.8%, and 1.5% were pushes (the total landing exactly on the number). Throw out the pushes and it's a hair under 50/50. That near-symmetry is the signature of an efficient market: if unders cashed 55% of the time, you could bet every under and print money, so the line moves until that edge is gone. The tiny tilt — a +0.70 average error, i.e. games going very slightly over the line on average — is a real artifact of rising scoring that the market chased a beat behind, but it is far too small to beat the vig.
A worked example: why “the total was wrong” usually isn't
Picture a game with a closing total of 44.5. It finishes 31–27 — 58 points, a +13.5 error, a comfortable over. Was the line “wrong”? Not in any useful sense. 44.5 was a perfectly reasonable central estimate; this game simply landed about one standard deviation into the right tail of the bell above. The next week the same 44.5 line produces a 13–10 rock fight — 23 points, a −21.5 error, an easy under. Average thousands of those and the misses cancel to +0.70. That cancellation is the unbiasedness; the ±13-point swings are the scatter. Same line, both truths — which is why a single game tells you nothing about whether a total was “good.”
Honest limitations: why a ~50% hit rate doesn't beat the book
- The vig eats the coin flip. A standard over/under is priced at −110: risk \$110 to win \$100. You must hit about 52.4% to break even, not 50%. A 49–49 market is precisely the market in which the average bettor loses slowly to the house's cut.
- Closing line, not opening. Every number here is the closing total — the sharpest version after a week of money has moved it. An opening number, or one you could bet midweek, is a different and generally less accurate object. “The total is unbiased” is a statement about the closing line specifically.
- Weather and pace live in the tails. Some of the biggest unders are wind games; some of the biggest overs are dome shootouts. The market prices the predictable part of that in advance, so what's left in the error distribution is mostly irreducible game-to-game noise.
- Pooling 27 seasons. Scoring and the totals market have drifted since 1999; an aggregate blends eras. The near-zero bias and the wide scatter are stable findings, but the exact +0.70 reflects the whole span, not any single year.
Reproduce it
Load data_layer/games.csv, keep games with a real total and total_line, and compute total − total_line per game. The distribution, mean, SD, and over/under/push rates are produced by explainer_src/make_total_error_chart.py, which reads the bundled nflverse log directly and stamps a “Data: nflverse” footer. No network, nothing hand-entered.
Further reading
- Free textbook: Chapter 22: Betting Market Analysis — the theory behind this, at DataField.dev.
- How accurate is the point spread? — the same market-efficiency story for spreads instead of totals.
- Is the NFL higher-scoring than it used to be? — the rising-scoring trend behind the tiny over lean.
- Weather and NFL scoring — what lives in the tails of the totals distribution.
Go deeper
Want the code behind these metrics? Work through the 45-chapter NFL analytics tutorial.
Browse tutorials Free tools