The finding: rest matters, but only when the gap is big
The NFL schedule is a grievance generator. Every season a team complains about a short week, a cross-country body-clock trip, or an opponent coming off a bye, and the broadcast treats each as a decisive edge. I pulled the complete nflverse game log bundled with this site — 7,276 played games from 1999 through 2025 — and measured what rest actually does to the scoreboard. The answer is more disciplined than the narrative: a small rest difference does almost nothing, but a large one is worth real points. A team with a bye-week-sized rest advantage wins by nearly twice its normal margin; a team whose opponent is that much fresher sees its home-field edge almost entirely erased.
The baseline to keep in mind: across all 7,276 games, home teams won 56.3% and won by an average of +2.34 points. That home margin is the yardstick everything below is measured against.
The exhibit: home margin by rest differential
I computed each game's rest differential — the home team's days of rest minus the away team's — and bucketed it, then averaged the actual home margin (result) in each bucket. A positive differential means the home team was the better-rested side.
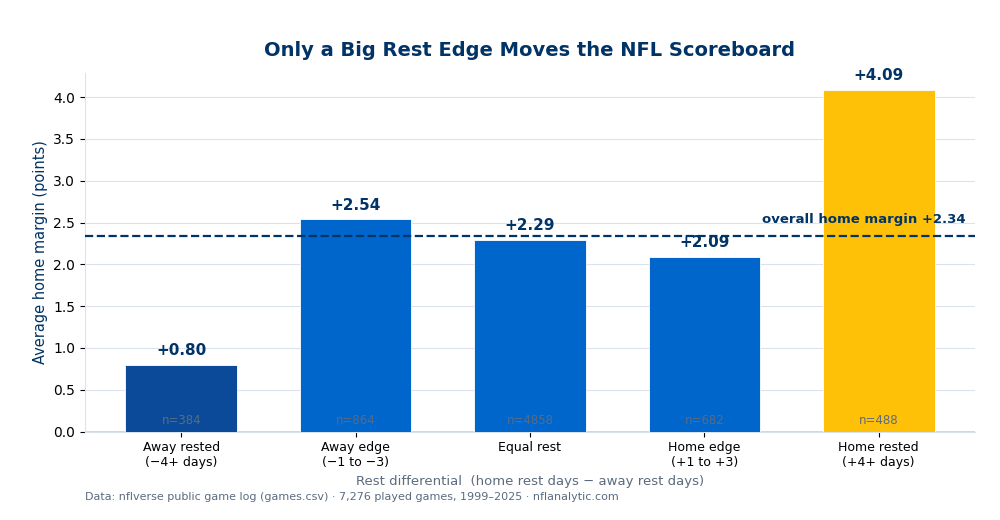
The shape is the message. The three middle buckets — a rest gap of zero, or one to three days either way — all sit right around the +2.34 baseline; small scheduling quirks wash out. It's the two ends that matter. When the home team is rested by four-plus days, the margin climbs to +4.09 and its win rate to 62.1%. When the away team holds that big rest edge, the home margin collapses to +0.80 and the home win rate to 52.6% — barely better than a coin flip. A large rest advantage is worth roughly a field goal of scoring margin, enough to nearly cancel home-field when it falls to the visitor.
What a "big" rest gap actually is
A four-plus-day differential isn't random noise — it's almost always a structural feature of the schedule. The biggest source is the bye week: a team off a bye carries about 13 days of rest into a game against an opponent on the standard 7, a six-day edge. The other end is the short week, most often a Thursday game four days after a Sunday, which shows up as a negative differential for whichever side is traveling on tired legs. So the extreme buckets in the chart are mostly "team off a bye" versus "normal" and "normal" versus "team on a short week." Those are exactly the situations the schedule-makers, and bettors, watch — and the data says they're right to.
What the data does not support is treating every one- or two-day wrinkle as meaningful. A team that played Sunday afternoon hosting one that played Sunday night has a rest edge of zero or one; the chart says that's worth essentially nothing. The grievance is real; the effect, at that scale, is not measurable in the final score.
A worked example: the bye-week host
Put numbers on it. A home team coming off its bye (≈13 days rest) hosting an opponent on the normal week (7 days) sits in the +4+ bucket. The model in the chart says to expect a home margin around +4.1 points rather than the usual +2.3 — an extra ~1.8 points of expected margin purely from the rest edge, and a jump in win probability from roughly 56% to 62%. Flip it: a home team on a short week hosting a rested visitor lands in the −4 bucket, where the home margin is just +0.8 and the visitor wins 47% of the time despite playing on the road. That swing — from +4.1 to +0.8 depending on which way the big rest gap points — is more than three points, which is why a bye-week matchup is one of the few scheduling spots that genuinely belongs in a power rating or a point-spread adjustment.
Honest limitations
- Rest is tangled with other scheduling effects. The big-gap buckets aren't pure rest — a team off a bye also gets extra prep time and a chance to heal, and a short-week team is often also traveling. The chart measures the combined effect of the whole situation, not rest hours in isolation. That's arguably the more useful number, but don't read it as "sleep alone is worth a field goal."
- The middle buckets carry most of the games. Nearly 6,400 of the 7,276 games sit in the three central buckets, so the baseline is rock-solid; the extreme buckets (384 and 488 games) are smaller and noisier. The direction is clear and consistent, but the exact +4.09 and +0.80 would wobble a little on a different sample.
- Quality isn't fully controlled. Bye placement and standalone (Thursday/Monday) games aren't handed out at random — the league schedules marquee teams into prime-time short weeks, which can confound rest with team strength. A full model would adjust for opponent quality; this is the raw, unadjusted picture.
- Pooling 27 seasons. The bye format, the Thursday-game slate, and scoring levels have all shifted since 1999. The aggregate blends eras; the rest effect is stable enough to trust as a general pattern, but the precise values drift year to year.
Reproduce it
This is one CSV and a group-by. Load data_layer/games.csv, keep rows with a real result and both rest columns, compute restdiff = home_rest − away_rest, bucket it, and average result (and the home-win rate) in each bucket. The chart and the full console breakdown are produced by explainer_src/make_rest_chart.py, which reads the bundled nflverse log directly and stamps a "Data: nflverse" footer onto the exhibit. No network, nothing hand-entered.
Further reading
- Theory: Chapter 26: Schedule and Rest Analysis — a free chapter at DataField.dev.
- Home-field advantage in the NFL is shrinking — the +2.3-point baseline this analysis adjusts from.
- Weather and NFL scoring — another environment effect read straight from the game log, where wind matters and cold doesn't.
- How accurate is the point spread? — why even a real rest edge is mostly already baked into the closing line.
Go deeper
Want the code behind these metrics? Work through the 45-chapter NFL analytics tutorial.
Browse tutorials Free tools