The finding: a handful of low scores rule the league
NFL final scores feel like they could be almost anything — and yet, across decades of games, the same small set of numbers keeps showing up on the scoreboard. We counted every exact final score in the bundled nflverse game log — 7,261 non-tie regular-season games from 1999 through 2025 — ordering each result as winner’s points first, and the leaderboard is remarkably top-heavy. A tiny cluster of low, one-score finals dominates, and the single most common final score in the modern NFL is 23–20, which has happened 139 times (1.91%).
The detail that gives the game away: the three most common final scores are all decided by exactly three points. After 23–20 come 20–17 (133 games, 1.83%) and 27–24 (129 games, 1.78%). That is not a coincidence. It is the scoring grammar of football — field goals worth 3 and touchdowns worth 7 — showing up directly in the leaderboard of where games end.
The exhibit: the leaderboard of final scores
Here are the 14 most common exact final scores, straight from data_layer/games.csv. Every bar is a low, one-score or two-score game, and the leaders sit right on top of one another.
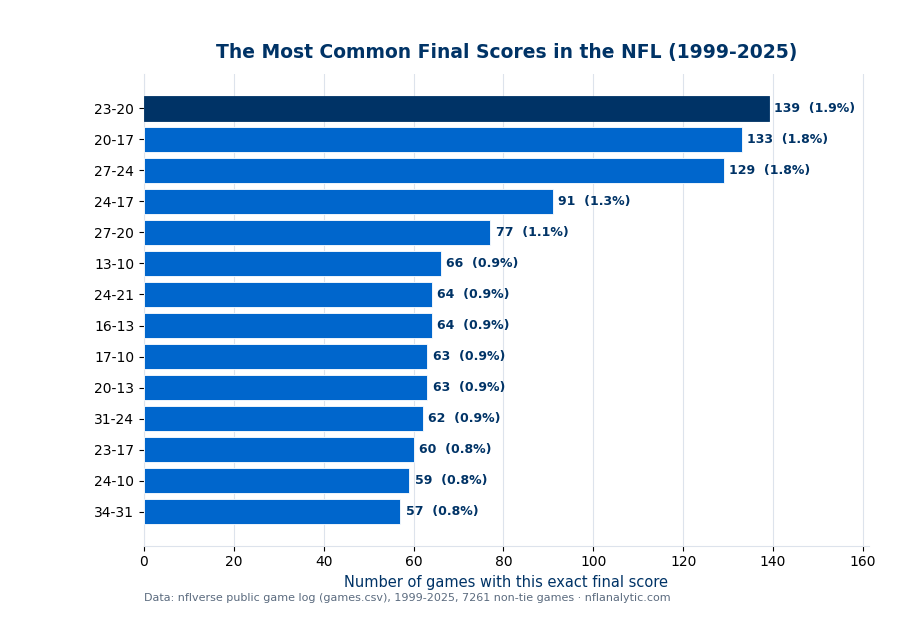
Read the chart from the top and a pattern jumps out. The leaders — 23–20, 20–17, 27–24 — are each separated by exactly three points, the most common margin of victory in football. Drop down the list and the same flavor repeats: 24–17 (91, 1.25%), 27–20 (77, 1.06%), 13–10 (66, 0.91%), 24–21 (64, 0.88%), 16–13 (64, 0.88%), 17–10 (63, 0.87%), 20–13 (63, 0.87%), 31–24 (62, 0.85%), 23–17 (60, 0.83%), 24–10 (59, 0.81%), and 34–31 (57, 0.79%). Every one of the 14 most common finals is a one-score or two-score game, and every winning and losing total is a clean sum of field goals and touchdowns.
The numbers behind the leaderboard
A worked example: take the leaders apart
The leaderboard stops looking random the moment you decompose a few of the totals into the plays that produce them. A touchdown with the extra point is worth 7; a field goal is worth 3. Almost every common score is just some combination of those two units.
Take the chart-topping 23–20 and break each side into its scoring plays:
- 23 = 7 + 7 + 3 + 3 + 3 — two touchdowns and three field goals.
- 20 = 7 + 7 + 3 + 3 — two touchdowns and two field goals.
The runner-up, 20–17, is built the same way:
- 20 = 7 + 7 + 3 + 3 — two touchdowns, two field goals.
- 17 = 7 + 7 + 3 — two touchdowns, one field goal.
Even the lower-scoring entries follow the rule. 13–10 is 13 = 7 + 3 + 3 (a touchdown and two field goals) against 10 = 7 + 3 (a touchdown and a field goal). And 16–13 simply adds one more field goal to each side: 16 = 7 + 3 + 3 + 3 versus 13 = 7 + 3 + 3.
This is why scores pile up where they do. A typical NFL offense produces a few touchdowns and a couple of field goals in a game, and the arithmetic of stacking 3s and 7s lands most teams somewhere in the high teens to high twenties. The most common finals cluster precisely where both teams arrive in that 17–to–27 band — close enough that the game is decided by a single score. Totals like 17, 20, 23, 24, and 27 are reachable by several different mixes of touchdowns and field goals, so they come up again and again; awkward numbers that require a missed extra point, a safety, or a two-point conversion are far rarer, because they need an unusual play to land on them.
The same story as the key numbers
If this feels familiar, it should. The dominance of 3 and 7 in the key numbers — the spikes in the margin-of-victory distribution — is the very same phenomenon seen from a different angle. Margins are the difference between two scores built from 3s and 7s, so they pile up on 3, 7, and their combinations. Final scores are the scores themselves, built from the same units, so they pile up on totals like 17, 20, 23, and 24. The reason the three most common final scores are all three-point games is exactly the reason 3 is the single most common margin: one team kicking one more field goal than the other is the most ordinary way for an NFL game to be decided.
Honest limitations
These counts cover regular-season games from 1999 through 2025. Older eras scored differently, and the two-point conversion (added in 1994) and the kicking rules around it nudge the mix. The leaderboard describes this window, not all of NFL history.
We counted the 7,261 games that produced a winner and a loser. Tie games, which are vanishingly rare, are left out, so every score here has a winner’s total listed first.
As offenses evolve — more touchdowns, the shifting math of missed extra points and two-point tries — the exact ordering moves over time. This is an era-dependent snapshot, not an eternal ranking.
A common score is just a score that happens often. None of this says a final is more likely for any given matchup, or that the scoreboard is drawn toward these numbers — only that, pooled across thousands of games, they come up most.
Reproduce it
Load data_layer/games.csv, keep the regular-season games, order each result as winner’s points first, and count how often each exact (winner_score, loser_score) pair occurs. Sort by frequency and the leaderboard above falls out. The chart is produced by explainer_src/make_common_scores_chart.py, which reads the bundled nflverse log directly and stamps a “Data: nflverse” footer — no network calls, nothing hand-entered.
Further reading
- Free textbook: Chapter 22: Betting Market Analysis — the theory behind this, at DataField.dev.
- Key Numbers — why 3 and 7 dominate the margins, the same phenomenon viewed through the difference between scores.
- How scoring has risen — why the leaderboard of final scores drifts as offenses evolve.
- Points per drive — how those 3s and 7s get produced one possession at a time.
- How often games go to overtime — the tight, low-margin games that feed the three-point finals.
- Pro Football Reference — box scores and final results for every game in the database.
Go deeper
Want the code behind these metrics? Work through the 45-chapter NFL analytics tutorial.
Browse tutorials Free tools