The finding: it's the wind, not the cold
Every December, the broadcast reaches for the same story. The temperature graphic comes up, someone says "this is going to be a low-scoring, grind-it-out game," and the freezing weather gets the blame. I pulled the complete nflverse game log bundled with this site — 7,276 played games from 1999 through the 2025 season — and checked the box scores against the conditions. The popular story is backwards. Cold barely moves NFL scoring at all. Wind moves it a lot. And the highest-scoring environment in football isn't a warm afternoon — it's indoors, where there's no weather to speak of.
Three numbers carry the whole argument. Games played in a dome or under a closed roof average 46.9 total points. Outdoor games average 43.4. And within those outdoor games, the average total slides straight down as the wind picks up: 44.7 points in calm conditions (0–5 mph) falling to 40.5 once the wind tops 16 mph — a swing of more than four points, about a made field goal and an extra possession's worth of offense, attributable to air alone.
The exhibit: scoring by playing environment
Here is the average total points by environment directly from data_layer/games.csv — the dome/closed-roof baseline on the left, then outdoor games split into wind-speed buckets.
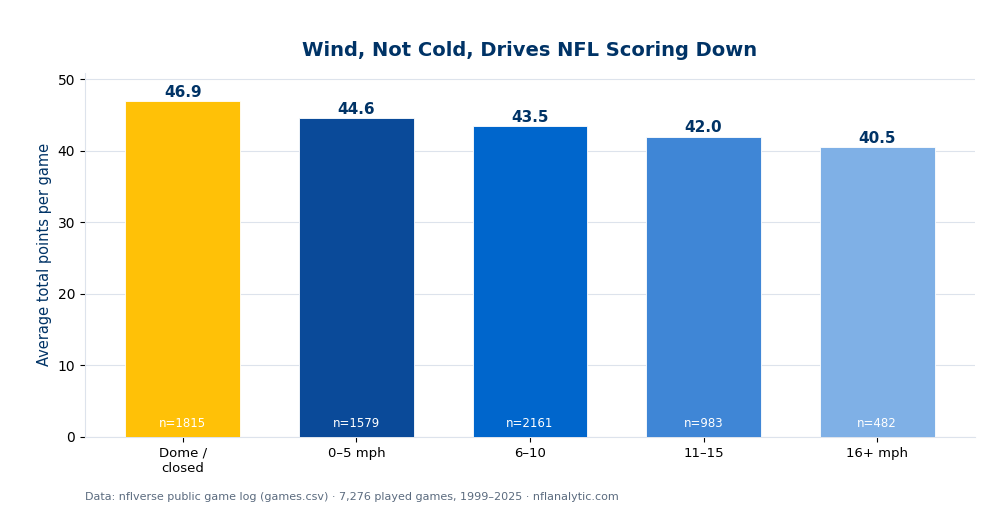
The shape is the message. There's no cliff — it's a steady decline, exactly what you'd expect if wind is shaving a little efficiency off every dropback and every kick rather than switching the offense off. The dome bar sitting above even the calmest outdoor games is the same effect with the wind set to zero and the footing perfect.
The cold myth, in one table
If temperature were the driver, scoring should fall as the thermometer does. It doesn't. Split the same outdoor games by game-time temperature and the averages are nearly flat:
| Temperature | Games | Avg total points |
|---|---|---|
| 32°F or colder (freezing) | 384 | 43.4 |
| 33–49°F | 1,220 | 43.0 |
| 50–69°F | 2,159 | 43.7 |
| 70°F or warmer | 1,442 | 43.0 |
Outdoor games only, nflverse game log, 1999–2025. Dome/closed games are excluded because they have no recorded temperature.
A freezing game averages 43.4 points; a balmy 70-degree game averages 43.0. The coldest football on the schedule is, if anything, a hair higher-scoring than the warmest — the differences here are noise. Whatever cold does to your hands in the stands, it is not measurably suppressing points on the field. The "frozen tundra, low score" intuition is a story we tell because cold is visible and wind is not.
Why wind, specifically
Wind attacks the two things modern offenses depend on most: the deep pass and the kicking game. A ball in flight is at the mercy of a crosswind or a headwind for the entire time it's airborne, and the longer the throw, the longer the wind has to act on it. Deep shots die, sideline throws sail, and quarterbacks check down — which trims yards per attempt and, with it, the explosive plays that produce touchdowns instead of field goals. The kicking game takes a second hit: long field goals that are routine in still air become genuine question marks into a 20-mph wind, so coaches punt where they'd otherwise try three points, and some of those three-point trips turn into zero.
Cold, by contrast, hits both teams' hands and the ball equally and mostly washes out. Domes top the chart for the mirror-image reason: no wind, perfect footing, a consistent fast track, and climate control. That's the same controlled-environment edge that shows up elsewhere in the data — teams built indoors tend to be pass-first, timing-based offenses, and the conditions never take their best plays away.
How to use it
The practical read is narrow and useful: when you see a number, look at the wind line before the temperature line. A forecast of 18–20 mph is worth real points off a game total in a way that a forecast of 25°F simply isn't. The four-point gap between calm and windy is roughly the size of edges that move betting totals, and it's why sharp total-setters adjust hard for wind and barely at all for cold. It also reframes the dome: a high total in a dome isn't a fluke of two good offenses meeting — it's partly the building. The environment is doing some of the scoring.
None of this predicts a single game. A windy game can still shoot out and a dome game can still bog down; these are averages over thousands of games, and the scatter around them is enormous, the same way the point spread nails the average and misses individual games. Weather shifts the center of the distribution a few points. It doesn't tell you where Sunday lands inside it.
Honest limitations
- Weather is unmeasured indoors. Dome and closed-roof games carry no temp or wind in the file, so the indoor bar is a clean comparison only against outdoor scoring — it can't be sliced by conditions because there aren't any. The wind and temperature breakdowns are outdoor games only.
- Recorded wind is imperfect. The wind figure is a single game-time reading, not an average over four quarters, and stadium architecture, swirl, and gusts mean the number on the page is a rough proxy for what the ball actually felt. Real wind effects are probably a touch larger than a single reading suggests.
- Confounding with team type. Cold-and-windy outdoor sites (Buffalo, Chicago, Cleveland) tend to build run-leaning rosters precisely because of their weather, so some of the "wind lowers scoring" effect is teams adapting to wind, not just wind acting on a neutral offense. Cause and roster construction are tangled here, and game totals can't fully separate them.
- Pooling 27 seasons. Scoring, rules, and dome construction have all shifted since 1999; an aggregate over the whole span blends eras. The wind gradient is stable enough to trust, but the exact point values drift year to year.
- Selection. The file is played games with a recorded combined score. Postponements and missing weather rows drop out, and the densest cold-weather sample is late-season and playoff football, which isn't a random slice of the schedule.
Reproduce it
Every number here is one CSV and a group-by. Load data_layer/games.csv, keep rows with a real total (the combined final score), split on roof for indoor versus outdoor, then bucket the outdoor games by wind and by temp and take the mean of total in each bucket. The chart and the full console breakdown — including the flat temperature table — are produced by explainer_src/make_weather_chart.py, which reads the bundled nflverse log directly and stamps a "Data: nflverse" footer onto the exhibit. No network, nothing hand-entered.
Further reading
- Theory: Chapter 24: Weather Effects — a free chapter at DataField.dev.
- How accurate is the point spread? — why a real, weather-aware edge in the average still scatters wildly game to game.
- Home-field advantage in the NFL is shrinking — another environment effect read straight from 27 seasons of results.
- Expected points — the framework for why losing explosive plays and field-goal range to the wind costs points.
Go deeper
Want the code behind these metrics? Work through the 45-chapter NFL analytics tutorial.
Browse tutorials Free tools