The Finding: Home Field Is Worth Less Against Teams You Know
Division rivals play each other twice a year, every year. The coaches have studied the same film for a decade; the players have lined up across from each other dozens of times; nothing about the building, the crowd, or the scheme is a surprise. That familiarity has a measurable cost — it eats into home-field advantage. I pulled the complete nflverse game log bundled with this site — 7,276 played games across the 27 seasons from 1999 through 2025 — split every game into division and non-division matchups, and computed home win percentage and average home margin in each bucket. The gap is real: home teams win 57.2% of non-division games but only 54.8% of division games, and the average home margin falls from +2.61 points to +1.91.
This is not a hot take. It is one of the more durable findings in football's situational research, and below I show exactly how I got the numbers, the chart that makes the gap visible, and the reasons to be careful about reading too much into it.
The Exhibit: Home Win% in Division vs. Non-Division Games
Here is the picture. Each bar is home win percentage for one bucket of games, computed from every played game in the dataset (ties counted as half a win, the standard convention). The dotted line marks the 50% coin-flip baseline you would expect if the venue meant nothing; the annotation on each bar carries the average home margin and the sample size.
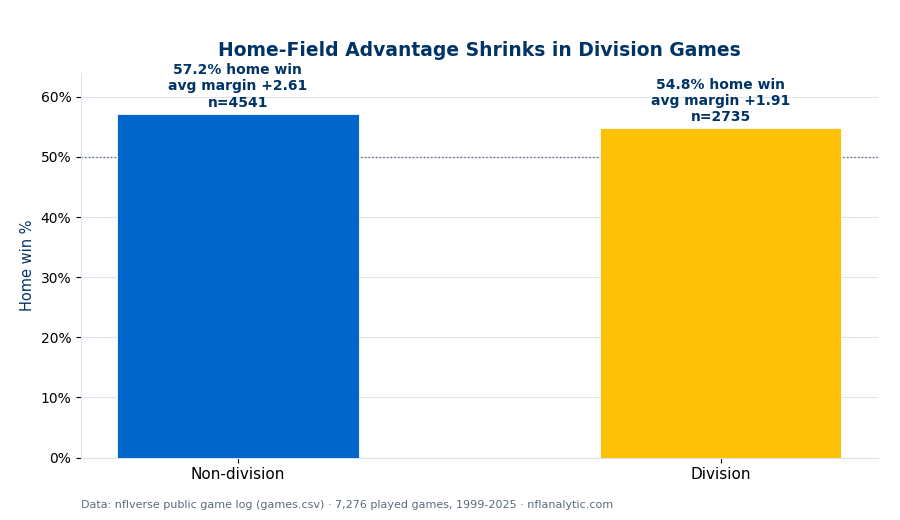
The two bars sit closer together than people expect, which is the point: both are above the 50% line, so home field still helps in both cases — but the division bar is visibly shorter. The 2.4-point drop in win rate and the 0.7-point drop in margin both push the same direction. With 4,541 non-division games and 2,735 division games behind the comparison, the gap is not a small-sample artifact; it persists across the full 27-season window.
Why Familiarity Eats the Home Edge
Home-field advantage is not one thing — it is a bundle of small effects: travel fatigue for the visitor, crowd noise on third down, comfort with the surface and sightlines, and the harder-to-measure edge of facing an opponent who does not know your building or your tendencies. A division rival cancels most of that last category. They make the same trip every year, they have heard the same crowd, and crucially their coaching staff has a full book on yours. The unfamiliarity tax that the host normally collects is something a twice-a-year opponent has already paid down.
The mechanism in one line
Home field is largely an information and discomfort advantage. Division rivals are the league's most informed, least discomfited visitors — so they surrender the smallest home edge.
There is a scheduling wrinkle worth naming, too. Division games are evenly split — each pair plays once at each site every season — so the comparison is not contaminated by one side hosting more often. That balance is part of why the division bucket is a clean read: the home/road assignment is symmetric by construction.
Caveats and Limits
Division and non-division games differ in more than familiarity — opponent quality, divisional parity, and scheduling spots all vary. The 0.7-point gap is the raw split, not a clean estimate of "familiarity" with everything else held fixed.
You only play your own division; non-division opponents are drawn from the whole league. If divisions cluster strong and weak teams unevenly, some of the gap reflects who you play, not familiarity itself.
2.4 percentage points and 0.7 points of margin are real over thousands of games but small for any single matchup. Do not overweight "it's a division game" as a handicapping factor; it is a nudge, not a swing.
Because overall home-field advantage has declined over this window, both buckets are pulled down in recent years. The division/non-division gap is the stable part; the levels drift with the era.
The bottom line
Across 1999–2025, NFL home teams won 57.2% of non-division games by an average of +2.61 points, but only 54.8% of division games by +1.91. Home field still helps against rivals — both numbers beat a coin flip — but it helps less, because the travel-and-unfamiliarity bundle that powers home advantage is exactly what a twice-a-year opponent has already neutralized. Treat it as a small, real discount on home field whenever a division rival comes to town, not as a deciding factor on its own.
Further reading
- Free textbook: Chapter 25: Home Field Advantage Deep Dive — the full treatment of what drives the home edge, at DataField.dev.
- Home-Field Advantage, Measured — the 27-season decline this piece splits apart
- How Accurate Is the Point Spread? — whether the market already prices effects like this in
- Strength of Schedule, Adjusted — the opponent-quality piece this raw split can't isolate
- Pro-Football-Reference — game logs and splits for every team-season
Go deeper
Want the code behind these metrics? Work through the 45-chapter NFL analytics tutorial.
Browse tutorials Free tools