The Question: How Big Do NFL Streaks Really Get — and Does It Take Anything Beyond Chance?
Every long winning streak gets the same two-part coverage: awe at the number, then a story about momentum — a team that "knows how to win," a locker room that forgot how. Both halves are checkable, because the nflverse game file carries every final score since 1999: 6,967 played regular-season games across 27 seasons. This page builds the full census of streaks from that file — every run of consecutive wins and consecutive losses, named and dated — and then asks the question the awe usually skips: how many of these streaks would a league of weighted coin flips produce on the same schedule?
Definitions, so every number is checkable: a streak is a maximal run of consecutive regular-season wins (or consecutive losses) by one franchise with its games in date order. Streaks are allowed to span seasons — the offseason doesn't break one, which is the record book's own convention — and the playoff-inclusive variants are quoted separately and labeled as such. Ties break both kinds (there are 15 in the window). Relocated franchises are mapped through their moves (SD→LAC, STL→LA, OAK→LV). The window is the file: 1999–2025, so older legends — Tampa Bay's 26 straight losses of 1976–77, for instance — live outside it, and that's stated rather than smuggled in.
The Exhibit: Every Monster Streak on the Calendar, and the Census vs. Chance
Left panel: every win streak of 13+ games (amber) and every losing streak of 14+ (blue), placed on the calendar — the bar spans the streak's first to last game, so season-spanning runs read as long bars crossing a New Year. Right panels: the number of distinct streaks of length ≥ L observed across the whole file, against the band a strength-aware chance baseline produces.
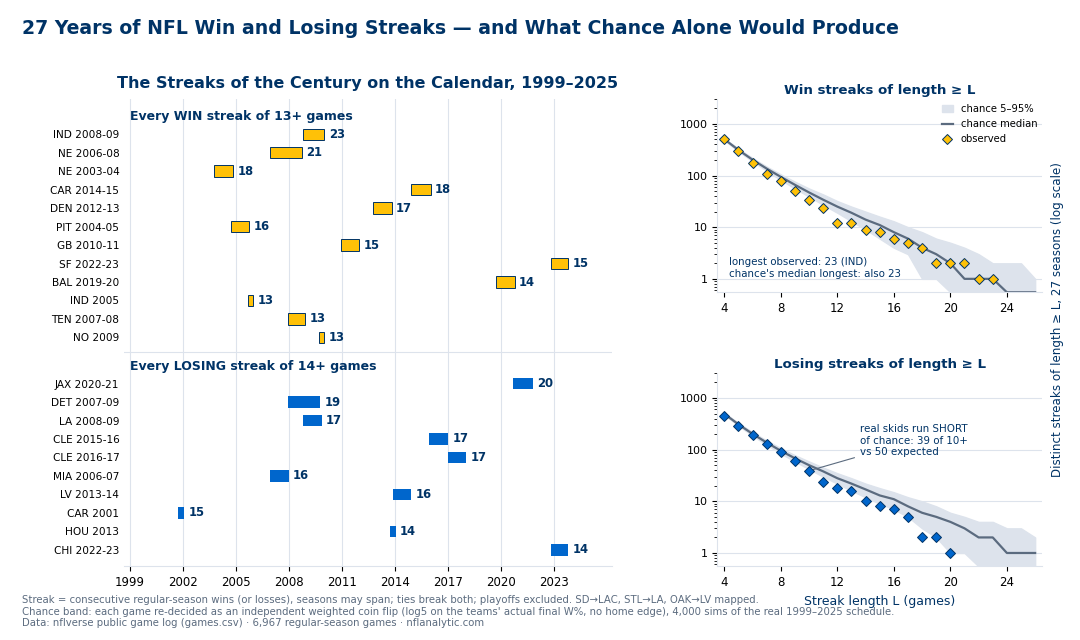
The full ledger of the win streaks — all twelve that reached 13 games:
| Streak | Games | First win | Last win | Snapped by |
|---|---|---|---|---|
| IND 2008–09 | 23 | 18-15 vs NE, Nov 2, 2008 | 35-31 at JAX, Dec 17, 2009 | NYJ 29-15, Dec 27, 2009 |
| NE 2006–08 | 21 | 40-7 vs HOU, Dec 17, 2006 | 19-10 at NYJ, Sep 14, 2008 | MIA 38-13, Sep 21, 2008 |
| NE 2003–04 | 18 | 38-30 vs TEN, Oct 5, 2003 | 13-7 vs NYJ, Oct 24, 2004 | PIT 34-20, Oct 31, 2004 |
| CAR 2014–15 | 18 | 41-10 at NO, Dec 7, 2014 | 38-35 at NYG, Dec 20, 2015 | ATL 20-13, Dec 27, 2015 |
| DEN 2012–13 | 17 | 35-24 at LAC*, Oct 15, 2012 | 35-19 vs JAX, Oct 13, 2013 | IND 39-33, Oct 20, 2013 |
| PIT 2004–05 | 16 | 13-3 at MIA, Sep 26, 2004 | 27-7 at HOU, Sep 18, 2005 | NE 23-20, Sep 25, 2005 |
| GB 2010–11 | 15 | 45-17 vs NYG, Dec 26, 2010 | 46-16 vs LV*, Dec 11, 2011 | KC 19-14, Dec 18, 2011 |
| SF 2022–23 | 15 | 31-14 at LA, Oct 30, 2022 | 42-10 vs DAL, Oct 8, 2023 | CLE 19-17, Oct 15, 2023 |
| BAL 2019–20 | 14 | 26-23 at PIT, Oct 6, 2019 | 33-16 at HOU, Sep 20, 2020 | KC 34-20, Sep 28, 2020 |
| IND 2005 | 13 | 24-7 at BAL, Sep 11, 2005 | 26-18 at JAX, Dec 11, 2005 | LAC* 26-17, Dec 18, 2005 |
| TEN 2007–08 | 13 | 26-17 at KC, Dec 16, 2007 | 24-14 at JAX, Nov 16, 2008 | NYJ 34-13, Nov 23, 2008 |
| NO 2009 | 13 | 45-27 vs DET, Sep 13, 2009 | 26-23 at ATL, Dec 13, 2009 | DAL 24-17, Dec 19, 2009 |
And the losing streaks — all ten that reached 14 (six more sit at 13):
| Streak | Games | First loss | Last loss | Snapped by |
|---|---|---|---|---|
| JAX 2020–21 | 20 | 30-33 at TEN, Sep 20, 2020 | 19-37 vs TEN, Oct 10, 2021 | W 23-20 vs MIA, Oct 17, 2021 |
| DET 2007–09 | 19 | 13-34 at GB, Dec 30, 2007 | 13-27 vs MIN, Sep 20, 2009 | W 19-14 vs WAS, Sep 27, 2009 |
| LA* 2008–09 | 17 | 16-23 at NE, Oct 26, 2008 | 6-42 vs IND, Oct 25, 2009 | W 17-10 at DET, Nov 1, 2009 |
| CLE 2015–16 | 17 | 13-30 at SEA, Dec 20, 2015 | 13-33 at BUF, Dec 18, 2016 | W 20-17 vs LAC*, Dec 24, 2016 |
| CLE 2016–17 | 17 | 24-27 at PIT, Jan 1, 2017 | 24-28 at PIT, Dec 31, 2017 | T 21-21 vs PIT, Sep 9, 2018 |
| MIA 2006–07 | 16 | 0-21 at BUF, Dec 17, 2006 | 17-38 at BUF, Dec 9, 2007 | W 22-16 vs BAL, Dec 16, 2007 |
| LV* 2013–14 | 16 | 19-23 vs TEN, Nov 24, 2013 | 6-13 at LAC*, Nov 16, 2014 | W 24-20 vs KC, Nov 20, 2014 |
| CAR 2001 | 15 | 16-24 at ATL, Sep 23, 2001 | 6-38 vs NE, Jan 6, 2002 | W 10-7 vs BAL, Sep 8, 2002 |
| HOU 2013 | 14 | 9-30 at BAL, Sep 22, 2013 | 10-16 at TEN, Dec 29, 2013 | W 17-6 vs WAS, Sep 7, 2014 |
| CHI 2022–23 | 14 | 29-49 at DAL, Oct 30, 2022 | 28-31 vs DEN, Oct 1, 2023 | W 40-20 at WAS, Oct 5, 2023 |
Scores read from the streaking team's side. Starred codes are pre-relocation rows shown under the current franchise: LA* = St. Louis-era Rams, LAC* = San Diego-era Chargers, LV* = Oakland-era Raiders. Regular season only; ties break streaks; the playoff-inclusive variants are in the limitations section below.
The Honest Read: Streaks Prove Quality Varies, Not That Momentum Exists
First, the survivorship intuition. "Somebody is always on a streak" isn't mysticism; it's ticket volume. The file holds 3,174 maximal win streaks, and half the drama dies immediately — 1,585 of them are one win long. Only 178 ever reached six games, 33 reached ten, and one reached 23. When a century of football buys more than 6,300 lottery tickets across both directions, the record book's monsters are what the winning tickets of an extreme-value lottery look like — the correct baseline for "wow" is never one team's chance of streaking, it's the whole league's chance that someone does.
So the test is a simulation with the drama removed. Take the real 1999–2025 schedule, all 6,967 games in order, and re-decide every game as an independent weighted coin flip — P(win) from the two teams' actual final season records via the log5 formula, no home edge, no momentum, no memory of yesterday. Do that 4,000 times and count streaks. This null hypothesis is deliberately hard to beat: it is handed the answer key for team quality (final W%), and it randomizes only the order in which wins arrive. The result: the median simulated century's longest win streak is 23 — exactly the Colts' real number — and 59% of simulated centuries produce a 23-game winner somewhere. At the record-book tail, reality and chance are indistinguishable: 4 real win streaks reached 18+ against a chance median of 4; 2 reached 20+ against a median of 2.
The middle of the distribution is where reality deviates — and it deviates downward. The file has 33 win streaks of 10+ against a simulated median of 47 (5–95% band: 39–56), and 12 of 12+ against a median of 25 (band 19–32) — below the band in both cases. Losing streaks undershoot harder: 39 skids of 10+ versus 50 expected, and the century's longest real skid (Jacksonville's 20) is shorter than the null's median longest of 28 — 98.8% of simulated centuries produce a 20-gamer or worse. Real NFL sequences are, if anything, mildly anti-streaky relative to weighted coin flips. Before anyone builds a "regression fairy" theory on that: the undershoot has boring candidate explanations, led by the null's own hindsight bias — a 1-15 record partly is its long skid, so feeding final W% back in as "true strength" makes the null streak-friendlier than an honest forecast would be. The null also holds strength constant all season (real teams bench quarterbacks and change mid-stream — the QB-continuity data is that story) and ignores home-field advantage, whose home/away alternation breaks real runs a little more often than a flat average would.
And the other side of the coin: quality is load-bearing. Run the same 4,000 replays with every game a fair 50/50 flip and the streaks collapse: the median fair-coin century's longest win streak is 13, only 21% of fair-coin centuries produce even one 15-gamer, and none of 1,000 produced a 23. You cannot get the Colts' 23 or the Jaguars' 20 out of parity plus luck; you need genuinely mismatched teams. That's the two-sided verdict of the exhibit: streaks are what spread-out team quality looks like when the calendar flips its coins — and nothing in 27 years of them requires momentum, heat, or teams that "know how to win" beyond what their records already say.
Worked Examples: The Streaks Up Close
All of these are straight rows from the game file:
- The 23: Indianapolis, Nov 2, 2008 – Dec 17, 2009. Nine straight to close 2008, then a 14-0 start to 2009 — an opening run bettered only by New England's 16-0 in 2007 and matched only by Carolina's 14-0 in 2015. It began by beating the previous streak kings 18-15 (New England, Nov 2, 2008) and ended 29-15 against the Jets on Dec 27, 2009, a game remembered in the public record for the Colts lifting their starters with 14-0 alive; the file just records the score. The kicker: 2009 held two monster unbeaten starts at once — New Orleans opened 13-0 the same season — and the two streak teams met in that season's Super Bowl (the best-record piece has the ending: Saints 31, Colts 17).
- The 21 that contains a perfect season: New England, Dec 17, 2006 – Sep 14, 2008. Three wins to close 2006, all sixteen of 2007, two to open 2008. Note what the regular-season convention hides: the Super Bowl XLII loss to the Giants sits inside this streak without breaking it. And the last two wins came from two different quarterbacks — the file's starter column reads Tom Brady on Sep 7, 2008 (W 17-10 vs KC) and Matt Cassel on Sep 14 (W 19-10 at NYJ); the torn ACL between those rows is public record. Miami ended it 38-13 a week later.
- The 36-game trough with one win in it: Cleveland, Dec 2015 – Sep 2018. The Browns are the only franchise on the loss table twice, and the two 17s are separated by a single game: from Dec 20, 2015 through the 2018 opener Cleveland went 1-34-1 across 36 games. The one win: 20-17 over San Diego, Dec 24, 2016. The second 17 is Pittsburgh-bracketed at every hinge — it started at PIT (24-27, Jan 1, 2017), its final loss was at PIT (24-28, Dec 31, 2017), and it ended not with a win but with a 21-21 tie vs PIT (Sep 9, 2018). That tie is why conventions matter: it snapped the 17-game losing streak but extended the winless run to a file-record 19 games (0-18-1), which finally ended 21-17 over the Jets on Sep 20, 2018.
- The 20, bookended by one opponent: Jacksonville, Sep 20, 2020 – Oct 10, 2021. Won the 2020 opener, then lost 15 straight (the file's longest single-season skid since 2001), then five more to open 2021. First loss: 30-33 to Tennessee. Twentieth loss: 19-37 to Tennessee. Snapped 23-20 over Miami on Oct 17, 2021.
- The one-season maximums. Counted inside a single season, the longest win streak is 16 — the 2007 Patriots' perfect season — and the longest losing streak is also 16, shared by the file's two 0-16 teams, the 2008 Lions and the 2017 Browns. All three sat inside longer cross-season runs (the 21, the 19, and the second Cleveland 17 above). The longest skid that both began and ended within one season's schedule belongs to 2001 Carolina: won the opener, lost the remaining 15, then won the 2002 opener 10-7 — consecutive opening-day wins with fifteen losses in between.
- Streaks made of quarterbacks: Indianapolis appears on both tables. The franchise that won 23 straight (and 13 straight in 2005, and 11 straight in 1999) also lost 13 straight in 2011. The file's starting-QB column explains the whiplash without a single adjective: every 2010 Colts game lists Peyton Manning; the 2011 column lists only Curtis Painter, Kerry Collins, and Dan Orlovsky. The QB-continuity explainer quantifies exactly this cliff.
Where 2025 Ranks, and the Streaks Alive Right Now
2025's longest run each way was solidly mid-history: Denver won 11 straight (Sep 29 – Dec 14, on the way to 14-3) before Jacksonville ended it 34-20 — eight seasons since 1999 produced a longer win streak and five others also peaked at 11. The Raiders supplied the skid: 10 straight losses, opened with a 31-0 blanking at Kansas City (Oct 19) and closed, with a straight face, by beating Kansas City 14-12 on Jan 4, 2026. New England won 10 straight before Buffalo stopped them 35-31; Tennessee carried a 10-gamer across the 2024–25 offseason before winning 22-21 in Arizona on Oct 5.
The longest runs still alive entering 2026, with their openers already on the schedule: Houston, 9 straight wins, opens Sunday Sep 13 vs Buffalo; Jacksonville, 8 straight wins, opens vs Cleveland; champion Seattle, 7 straight wins, opens the season itself on Wednesday Sep 9 against New England — the Super Bowl rematch the schedule-quirks piece covers. On the other ledger: Arizona enters on 9 straight losses (at LAC, Sep 13), Indianapolis on 7, and Kansas City — 15-2 as recently as 2024 — closed 2025 with six straight losses and reopens Monday night Sep 14 against the Denver team that beat them on Christmas. None of the active runs threatens the tables above yet; Houston would need to win its first four 2026 games just to reach the 13 line.
Honest Limitations
- "Regular season only" is a real editorial choice. It's the record book's convention (Indianapolis' 23 is quoted this way everywhere), but it renders playoff games invisible: New England's 21 contains a Super Bowl loss, Denver's 17 and Baltimore's 14 contain playoff exits, Green Bay's 15 contains a Super Bowl win, and San Francisco's 15 sails straight through a conference-title-game loss. Under playoff-inclusive rules the century's longest win streak is New England's 21 in 2003–04 (18 regular season + 3 playoff wins, ended at Pittsburgh on Oct 31, 2004), ahead of Green Bay's 19 (2010–11) and the 2007 Patriots' 18; Indianapolis' 23 splits into 9 and 14, because a wild-card exit sits between them. The losing-streak top ten is identical either way — teams that lose 14 straight do not play January football.
- Ties are streak-breakers here, and that's debatable. The record book distinguishes "losing streak" (consecutive losses) from "winless streak" (no wins); Cleveland 2017–18 is the case where it matters — 17 straight losses, or 19 straight winless. Both are reported above. With only 15 ties in 6,967 games, no other top-ten entry changes.
- The window is censored at both ends. A streak alive on opening day 1999 might have been longer in truth, and the four active 2026-entering runs are still being written. None of the 22 streaks charted touches either edge, so the tables are safe; the census counts at short lengths are trimmed a hair at the boundaries.
- The chance baseline is generous to streaks by construction. It knows each team's final record — a number the streak itself helped produce — holds strength constant across a season, ignores home-field, and never ties. All four choices push simulated streak counts up, which is the honest reading of "reality sits below the band": it means the census needs no momentum to explain it, not that the league is provably anti-streaky. Building a bias-free null (pre-season strength estimates, week-by-week updating) would shrink the band toward reality; it would also stop being a two-line formula.
- One century, one draw. The observed maxima (23 and 20) are single samples from an extreme-value distribution; comparing them to simulated medians is fair but coarse. A couple of different bounces in December 2009 and the "record" this whole page anchors on moves.
- No cause is claimed for any single streak. The file shows that Indianapolis' 2011 collapse coincided with three replacement quarterbacks, and that half of all games land within one score (where streaks actually go to die) — it cannot show why any particular Sunday broke a run, and neither can anyone selling a momentum narrative.
How to Actually Use This
- Translate "streaking" back into "good." A 9-game winner is overwhelmingly likely to be an excellent team having a normal excellent-team stretch — the fair-coin league produced a 15-gamer in only 21% of whole simulated centuries. The streak is evidence about quality, and quality is already visible in the record; adding a momentum premium on top double-counts it.
- Never pay for streak continuation as its own factor. The census matches or undershoots independent flips at every length, so "they've won 10 straight, they're hot" adds nothing a plain strength estimate didn't already price. The same logic, run in reverse, retires "due for a win" — the coin has no memory in either direction.
- Expect the record to fall — slowly. Half of simulated centuries produce a 23-game winner, so treating Indianapolis' 23 as untouchable is survivorship talk; treating it as ordinary is also wrong (a fair-coin league needs quality spreads to get there). The honest sentence: given another quarter century of football with real quality gaps, a new record is roughly a coin flip.
- Use the actives as September priors, not prophecies. Houston's 9 and Jacksonville's 8 say those teams finished 2025 genuinely strong — the same thing their records say. Whether the runs survive Week 1 is close to a weighted coin flip against Buffalo and Cleveland respectively, and the Week 1 explainer covers how little that first answer will mean.
Reproduce It
One public file: games.csv from nflverse nfldata, bundled at /data/games.csv. Order each franchise's regular-season games by date, run-length encode the results, and the whole top table falls out; the simulation and chart live in explainer_src/make_streaks_chart.py (4,000 replays, seeded). The census core:
import pandas as pd, numpy as np
from itertools import groupby

df = pd.read_csv("https://nflanalytic.com/data/games.csv")
df[["home_team","away_team"]] = df[["home_team","away_team"]].replace(
    {"SD":"LAC","STL":"LA","OAK":"LV"})          # franchise continuity
g = df.dropna(subset=["home_score"])
g = g[g.game_type == "REG"]                      # 6,967 played games

h = g.rename(columns={"home_team":"team","home_score":"pf","away_score":"pa"})
a = g.rename(columns={"away_team":"team","away_score":"pf","home_score":"pa"})
cols = ["season","team","gameday","pf","pa"]
seq = pd.concat([h[cols], a[cols]]).sort_values(["team","gameday"])
seq["res"] = np.where(seq.pf > seq.pa, "W",
             np.where(seq.pf < seq.pa, "L", "T"))   # ties break streaks

best = []
for team, s in seq.groupby("team"):
    for res, run in groupby(zip(s.res, s.gameday), key=lambda x: x[0]):
        run = list(run)
        if res in "WL" and len(run) >= 13:
            best.append((len(run), res, team, run[0][1], run[-1][1]))
for n, res, team, d0, d1 in sorted(best, reverse=True):
    print(team, res, n, d0, "->", d1)   # IND W 23 2008-11-02 -> 2009-12-17
All figures on this page were computed 2026-08-02 on the 1999–2025 file (the 272 scoreless 2026 schedule rows drop out of the played-games filter). The simulation uses log5 win probabilities from final season W% (ties half, clamped to [0.03, 0.97]), no home edge, seed 20260802; re-running the script reproduces every number, including the chance bands. The historical rows will not change; the active-streak section will age with the 2026 season.
Data: nflverse/nfldata, public. Streak = maximal run of consecutive regular-season wins (or losses), date-ordered per franchise, seasons may span, ties break both; playoff-inclusive and winless variants quoted separately; SD→LAC, STL→LA, OAK→LV mapped throughout.
Go deeper
Want the code behind these metrics? Work through the 45-chapter NFL analytics tutorial.
Browse tutorials Free tools