The Question: Does the League's Best Record Actually Win the Title?
Every January the seedings come out and the same assumption comes with them: the team that just posted the league's best record is the team to beat. It's a checkable assumption, because the nflverse game file carries every final score since 1999 — 7,276 played games across 27 seasons, all 309 playoff games included, with a Super Bowl row for every season from 1999 through 2025. This page lines up each season's regular-season standings against what the playoffs then did to them.
Definitions, so every number is checkable: a team's regular-season W% counts ties as half a win (they matter — 2012 San Francisco went 11-4-1 and reached the Super Bowl). A team's record rank is its position when the league is sorted by W%, with tied teams sharing a rank — so "the best record" means a share of the league's top W%, and co-leaders all count. That happened constantly: 27 seasons produced 44 teams holding at least a share of the best record, including a five-way tie at 12-4 in 2014. Record rank is not official playoff seeding — no tiebreakers, no division-winner rules — which is exactly why it's the honest version of the "best team on paper" question. Relocated franchises are mapped through their moves (SD→LAC, STL→LA, OAK→LV).
The Exhibit: 27 Champions Against the Standings
Left panel: where each champion's regular-season record ranked league-wide, season by season — amber diamonds are the eight champions who held at least a share of the best record. Right panel: where the 44 best-record teams' seasons actually ended.
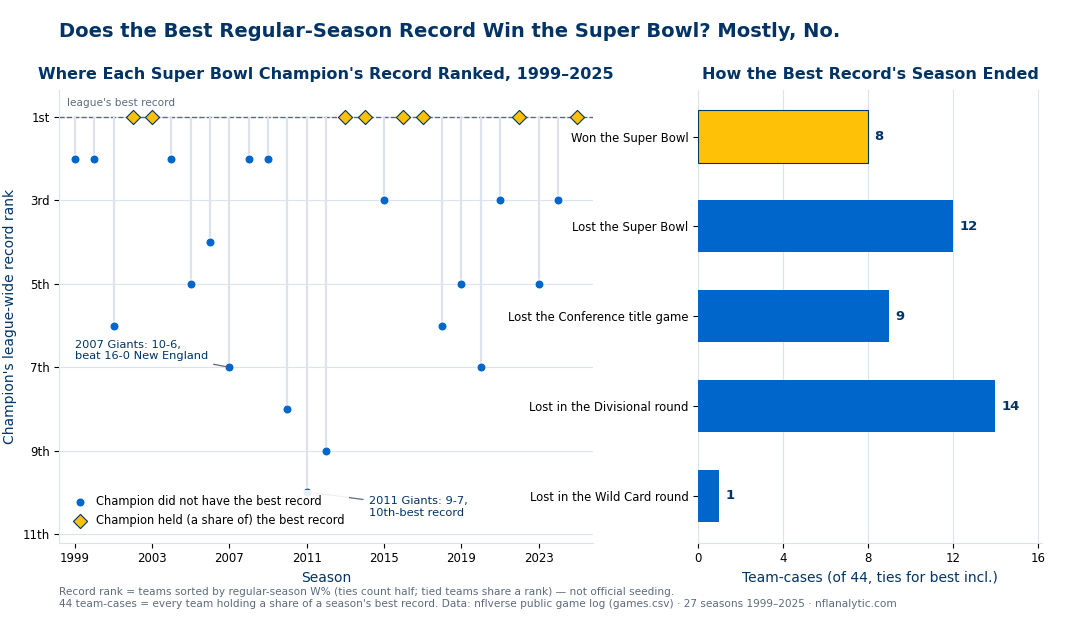
The full ledger — every champion, its league-wide and conference record rank, who actually owned the season's best record, and the Super Bowl score:
| Season | Champion | Lg rank | Conf rank | Best record that season | Super Bowl result |
|---|---|---|---|---|---|
| 1999 | LA* 13-3 | 2nd | 1st | JAX 14-2 | beat TEN 13-3, 23-16 |
| 2000 | BAL 12-4 | 2nd | 2nd | TEN 13-3 | beat NYG 12-4, 34-7 |
| 2001 | NE 11-5 | 6th | 2nd | LA* 14-2 | beat LA* 14-2, 20-17 |
| 2002 | TB 12-4 | 1st | 1st | GB, PHI, TB all 12-4 | beat LV* 11-5, 48-21 |
| 2003 | NE 14-2 | 1st | 1st | NE 14-2 (outright) | beat CAR 11-5, 32-29 |
| 2004 | NE 14-2 | 2nd | 2nd | PIT 15-1 | beat PHI 13-3, 24-21 |
| 2005 | PIT 11-5 | 5th | 4th | IND 14-2 | beat SEA 13-3, 21-10 |
| 2006 | IND 12-4 | 4th | 3rd | LAC* 14-2 | beat CHI 13-3, 29-17 |
| 2007 | NYG 10-6 | 7th | 3rd | NE 16-0 | beat NE 16-0, 17-14 |
| 2008 | PIT 12-4 | 2nd | 2nd | TEN 13-3 | beat ARI 9-7, 27-23 |
| 2009 | NO 13-3 | 2nd | 1st | IND 14-2 | beat IND 14-2, 31-17 |
| 2010 | GB 10-6 | 8th | 4th | NE 14-2 | beat PIT 12-4, 31-25 |
| 2011 | NYG 9-7 | 10th | 6th | GB 15-1 | beat NE 13-3, 21-17 |
| 2012 | BAL 10-6 | 9th | 5th | ATL, DEN 13-3 | beat SF 11-4-1, 34-31 |
| 2013 | SEA 13-3 | 1st | 1st | DEN, SEA 13-3 | beat DEN 13-3, 43-8 |
| 2014 | NE 12-4 | 1st | 1st | DAL, DEN, GB, NE, SEA 12-4 | beat SEA 12-4, 28-24 |
| 2015 | DEN 12-4 | 3rd | 1st | CAR 15-1 | beat CAR 15-1, 24-10 |
| 2016 | NE 14-2 | 1st | 1st | NE 14-2 (outright) | beat ATL 11-5, 34-28 (OT) |
| 2017 | PHI 13-3 | 1st | 1st | MIN, NE, PHI, PIT 13-3 | beat NE 13-3, 41-33 |
| 2018 | NE 11-5 | 6th | 3rd | LA, NO 13-3 | beat LA 13-3, 13-3 |
| 2019 | KC 12-4 | 5th | 2nd | BAL 14-2 | beat SF 13-3, 31-20 |
| 2020 | TB 11-5 | 7th | 4th | KC 14-2 | beat KC 14-2, 31-9 |
| 2021 | LA 12-5 | 3rd | 3rd | GB, TB 13-4 | beat CIN 10-7, 23-20 |
| 2022 | KC 14-3 | 1st | 1st | KC, PHI 14-3 | beat PHI 14-3, 38-35 |
| 2023 | KC 11-6 | 5th | 2nd | BAL 13-4 | beat SF 12-5, 25-22 (OT) |
| 2024 | PHI 14-3 | 3rd | 2nd | DET, KC 15-2 | beat KC 15-2, 40-22 |
| 2025 | SEA 14-3 | 1st | 1st | DEN, NE, SEA 14-3 | beat NE 14-3, 29-13 |
Franchise codes shown as current throughout: the starred LA rows (1999, 2001) are the St. Louis-era Rams, 2002's LV is the Oakland-era Raiders, and 2006's LAC is the San Diego-era Chargers. Bold = champion held at least a share of the league's best record. Ranks are record ranks (ties share a rank), not official seeds.
The Honest Read: The Best Record Is a Contender, Not a Favorite
Start with the headline count. A team holding at least a share of the league's best record won the title in 8 of 27 seasons. That is real signal — with 12 playoff teams (14 since 2020), a random qualifier would win far less often than 30% — so the standings do mean something. But the same group lost the Super Bowl 12 times and lost the conference title game 9 more. The single most common outcome of posting the league's best record is losing in the Divisional round: 14 of the 44 cases, from the 2000 Titans (13-3) to the 2024 Lions (15-2). In 12 of the 27 seasons, no team with a share of the best record even reached the Super Bowl.
Strip out the five all-best-record Super Bowls — 2013, 2014, 2017, 2022, and 2025, where co-leaders met and one of them had to win — and the picture sharpens further: facing an opponent with a worse regular-season W% in the Super Bowl, the best-record team went 3-7. The three wins are the 2002 Buccaneers, the 2003 Patriots, and the 2016 Patriots. The seven losses include a 14-2 team (three times), a 15-1 team, a 15-2 team, and the 16-0 team. Across all 27 Super Bowls, the side with the worse regular-season W% won 14, the better W% won 6, and 7 paired identical W%s. In this window, being the better regular-season team in the Super Bowl has been, if anything, mildly bad news.
The typical champion, then, isn't the paper №1. The median champion owned the league's 3rd-best record (mean 3.67), with a mean W% of .746 — a 12-or-13-win pace, not a 14-win one. Sixteen of 27 champions ranked top-3, twenty ranked top-5, and seven — about one champion in four — ranked 6th or worse. Within their own conference, champions' records ranked 1st just 11 times in 27 seasons (median: 2nd) — and record rank flatters them slightly, since it ignores the tiebreakers that real seeding hangs on. Eleven of the 27 champions had to play wild-card weekend. And the champion led the league in point differential only 7 times — though point differential still tracks quality better than the win column does, which is the Pythagorean-wins argument in one sentence.
The parity story is flatter than the folklore. Split the file into its three 9-season eras and the champion's mean record rank barely moves: 3.33 (1999–2007), 4.11 (2008–2016), 3.56 (2017–2025), with shared-best champions going 2, 3, and 3. What actually happened is one concentrated giant-killing spell: 2010–2012, three straight champions ranked 8th, 10th, and 9th (10-6 Green Bay, 9-7 Giants, 10-6 Baltimore) — with 2007's 10-6 Giants as the prologue. Since 2013 the bracket has tilted back toward the elite: the last 13 champions average a rank of 2.92, six of them held a share of the best record, and none ranked worse than 7th (the 2020 Buccaneers). "Any given champion" was less an era of football than a three-year window.
Worked Examples: The Standings vs the Bracket
All of these are straight rows from the game file:
- The .900 club is 0-for-4. Four teams in the file finished the regular season at .900 or better: the 15-1 Steelers (2004, lost the AFC title game), the 16-0 Patriots (2007, lost the Super Bowl 17-14 to a 10-6 Giants team ranked 7th), the 15-1 Packers (2011, lost their Divisional opener), and the 15-1 Panthers (2015, lost the Super Bowl 24-10). None won the title. In fact no champion in the file won more than 14 regular-season games — 14 is the ceiling, reached by six champions (2003, 2004, 2016, 2022, 2024, 2025) — while all six of the file's 15-win-or-better regular seasons ended without a title.
- The floor: the 2011 Giants. Nine wins, seven losses, outscored 400 to 394 across the regular season — the only champion in the file with a negative point differential (19th in the league that year, 10th in record, 6th in the NFC) — then four playoff wins ending with 21-17 over the 13-3 Patriots. The 2008 Cardinals are the receiving-end version: a 9-7 team ranked 12th made the Super Bowl and lost it by four points.
- 2014: five teams tied at the top, and the Super Bowl settled it. Dallas, Denver, Green Bay, New England, and Seattle all finished 12-4 — the biggest logjam in the file — and the bracket disposed of them one by one until two of the five met in the Super Bowl (New England 28, Seattle 24). That's the "best record wins" claim at its truest — and picking between the co-leaders still came down to a four-point final.
- The only wild-card-round exit: the 2002 Packers. Of 44 best-record team-cases, exactly one lost its playoff opener on wild-card weekend: Green Bay, 12-4 in a three-way tie at the top, blown out at home 27-7 by 9-6-1 Atlanta on January 4, 2003. Everyone else at least reached the Divisional round — where 14 of them died.
- 2024: the 15-2 pair goes 0-for-2. Detroit and Kansas City shared the file's second-best record ever at 15-2. Detroit lost its Divisional opener; Kansas City reached the Super Bowl and lost it 40-22 to 14-3 Philadelphia — the same Chiefs team that had taken a 38-0 blanking in a meaningless Week 18 game five weeks earlier (the shutouts piece tells that half of the story). A best record can be five weeks from a 40-22 loss; a shutout can be five weeks from a Super Bowl.
- 2025: the three-way tie, resolved on the field. The file's final completed season ends on theme: Denver, New England, and Seattle all finished 14-3. Denver lost the AFC title game, and Seattle beat New England 29-13 in the Super Bowl on February 8, 2026 — a best-vs-best final, the fifth in the file. The postscript is already on the schedule: the 2026 season opens Wednesday, September 9, with New England at Seattle — a straight Super Bowl rematch (the 2026 schedule-quirks piece covers that oddity of an opener).
- When the best record does convert, it tends to be close anyway. Of the eight best-record champions, five won one-score Super Bowls, and two of the 27 finals needed overtime (2016's 34-28 and 2023's 25-22) — playoff overtime being the variety that plays on until someone wins, as the overtime explainer lays out. Even certainty arrives by coin-flip margins.
Honest Limitations
- 27 is a small n. One Super Bowl per season means every percentage on this page is built from 27 trials. "8 of 27" is honestly different from "1 of 27", but treat 30% as a coarse estimate, not a law; a couple of different bounces in February would move it visibly.
- Record rank is not seeding. Real playoff seeds apply tiebreakers and guarantee division winners home games; this page sorts raw W% and lets ties share a rank. That's deliberate — the question is about the standings, not the bracket's furniture — but it means "ranked 2nd" here can differ from the official 2-seed. The seed version of this question would need a seeding column the game file doesn't carry.
- "Best record" is not "best team." A 14-3 record against a soft slate can be worse evidence than 12-5 against a gauntlet — W% ignores schedule entirely, and the schedule-strength audit shows real schedules diverge by about two wins of opponent quality per season. Point differential and opponent-adjusted ratings judge quality better; this page deliberately grades the raw standings because the raw standings are what the "best record" claim is about.
- Era pooling. The file spans 16-game (1999–2020) and 17-game (2021+) regular seasons, a 12-team and a 14-team playoff, and a format change (2020) that cut first-round byes from two per conference to one — visible in the file as the wild-card round growing from four games to six — which mechanically exposes more top teams to an extra playoff game. W% units make the eras comparable; the playoff gauntlet itself got genuinely harder for №1-adjacent teams. The 2022 Bills–Bengals cancellation also leaves two 16-game records inside a 17-game season.
- Survivorship in the framing. "The best record loses" is partly just arithmetic: with 44 best-record cases and only 27 titles available, most had to lose to somebody. The fair benchmark is the one in the text — 30% champions vs a ~8% random-qualifier baseline: far better than chance, far worse than the aura.
- No cause claimed. Single-elimination football is a 3-or-4-game sample where half of all games finish within one score; the playoff field is also quality-compressed. Both push toward upsets, and finals alone can't apportion the credit between them.
How to Actually Use This
- Reset the January prior. The honest sentence when the standings settle is: "the best record wins the title about 3 times in 10, and its most likely exit is the Divisional round." If a preview treats the №1 record as the presumptive champion, it's pricing the aura, not the base rate.
- Don't pay for the record gap in a Super Bowl matchup. The better regular-season W% went 6-14-7 in 27 finals. Two conference champions are, by construction, closely matched; by February the regular-season standings are mostly spent information. (The playoff rounds before the final are a different matter — home field, which the best record does buy, genuinely surges in the postseason, per the playoff-football numbers. The Super Bowl is the one game where that purchase stops working: neutral site.)
- Grade regular seasons and postseasons separately. A 15-2 season that ends in a Divisional loss was still a 15-2 season — treating the last game as the verdict on the previous seventeen is the same single-game overreaction the Week 1 data warns about in September. The file's message runs both directions: 9-7 champions exist, and 16-0 non-champions do too.
- Use "best record" as a shortlist, not a pick. Twenty of 27 champions ranked top-5 in W% — the winner almost always comes from the standings' upper shelf. The standings tell you who's in the room; they've been remarkably bad at telling you who walks out with the trophy.
Reproduce It
One public file: games.csv from nflverse nfldata, bundled at /data/games.csv. Build per-team regular-season W%, find each season's Super Bowl winner from the SB row, and compare. The chart and the full console breakdown come from explainer_src/make_best_record_chart.py; the core fits in twenty lines of pandas:
import pandas as pd, numpy as np

df = pd.read_csv("https://nflanalytic.com/data/games.csv")
df[["home_team","away_team"]] = df[["home_team","away_team"]].replace(
    {"SD":"LAC","STL":"LA","OAK":"LV"})          # franchise continuity
g = df.dropna(subset=["home_score"])             # 7,276 played games

cols = ["season","team","opp","pf","pa","game_type"]
h = g.rename(columns={"home_team":"team","away_team":"opp",
                      "home_score":"pf","away_score":"pa"})
a = g.rename(columns={"away_team":"team","home_team":"opp",
                      "away_score":"pf","home_score":"pa"})
reg = pd.concat([h[cols], a[cols]]).query("game_type == 'REG'").copy()
reg["win"] = np.where(reg.pf > reg.pa, 1.0,
             np.where(reg.pf < reg.pa, 0.0, 0.5))
wpct = reg.groupby(["season","team"]).win.mean()   # ties = half a win

sb = g[g.game_type == "SB"].copy()                 # one row per season, 27 rows
sb["champ"] = np.where(sb.home_score > sb.away_score,
                       sb.home_team, sb.away_team)

best = 0
for _, r in sb.iterrows():
    yr = wpct.xs(r.season, level="season")
    rank = int((yr > yr[r.champ]).sum()) + 1       # ties share a rank
    best += yr[r.champ] == yr.max()
    print(int(r.season), r.champ, "rank", rank)
print(best, "of", len(sb))                         # 8 of 27
All figures on this page were computed 2026-07-30 on the 1999–2025 file (the 272 scoreless 2026 schedule rows drop out of the played-games filter; the 2025 season's Super Bowl, played February 8, 2026, is in the file). The historical rows will not change; the ratios shift as future seasons append.
Data: nflverse/nfldata, public. W% counts ties as half a win; record rank = position in the league sorted by W%, ties sharing a rank (not official seeding); "best record" = a share of the season's top W%; SD→LAC, STL→LA, OAK→LV mapped throughout.
Go deeper
Want the code behind these metrics? Work through the 45-chapter NFL analytics tutorial.
Browse tutorials Free tools