The Question: Does Winning the Division Mean Anything Next Year?
Every June, eight fanbases talk themselves into "we're the defending division champs" and four more into "nowhere to go but up." Both claims are checkable. This page uses 2002–2025 — the 2002 realignment created the current eight-divisions-of-four structure, so every division-season in the window is like-for-like: 6,223 played regular-season games, 192 division titles, 184 season-to-season title defenses (8 divisions × 23 transitions).
The game file has no standings table, so standings are derived: win percentage, then the official NFL tiebreaker chain — head-to-head, division record, common games, conference record, strength of victory, strength of schedule — with the multi-club restart rule. Twenty-three of 192 titles (12%) needed a tiebreaker, and the derived chain reproduces the official winner in all 23, including the 2011 AFC West three-way (Denver via common games after the restart) and the 2024 NFC West (Rams on strength of victory, the deepest step ever needed).
The Exhibit: Where Champions and Doormats Finish a Year Later
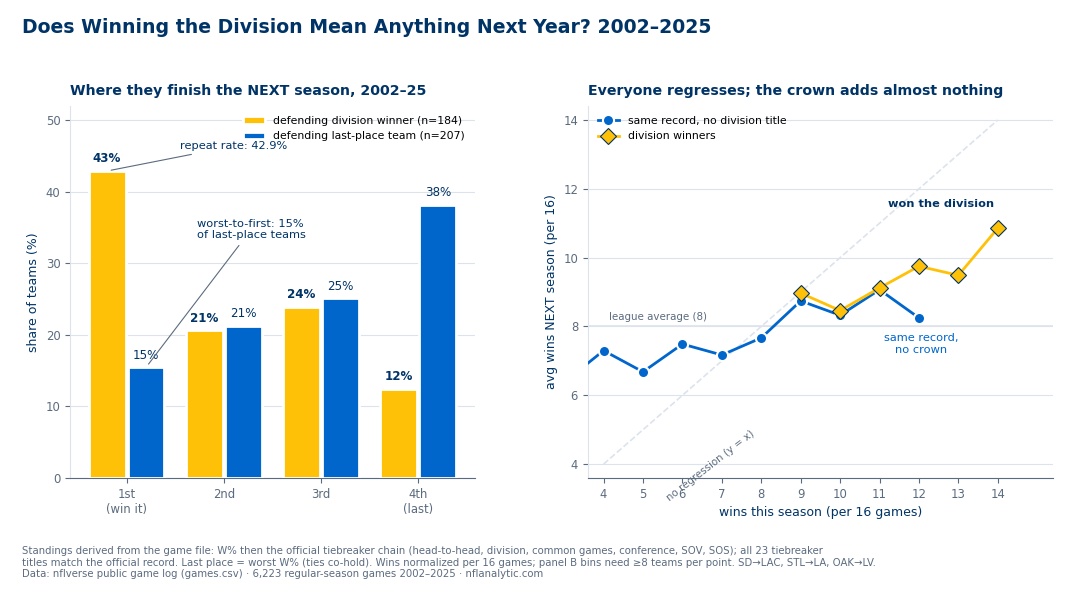
Left panel: next-season finishing place for all 184 defending winners (amber) and all 207 defending last-place teams (blue; ties for last count every co-holder). Right panel: next-season wins by this-season wins, winners against same-record non-winners.
The longest repeat runs in the window — every streak of five or more straight titles:
| Franchise | Division | Straight titles | Seasons | Ended by |
|---|---|---|---|---|
| New England | AFC East | 11 | 2009–2019 | Buffalo, 2020 |
| Kansas City | AFC West | 9 | 2016–2024 | Denver, 2025 |
| New England | AFC East | 5 | 2003–2007 | Miami, 2008 (tiebreaker) |
| Indianapolis | AFC South | 5 | 2003–2007 | Tennessee, 2008 |
| Denver | AFC West | 5 | 2011–2015 | Kansas City, 2016 |
| Buffalo | AFC East | 5 | 2020–2024 | New England, 2025 |
Five more franchises ran four straight (Seattle 2004–07, San Diego-era Chargers 2006–09, Green Bay 2011–14, New Orleans 2017–20, Tampa Bay 2021–24). Every 5+ streak is an AFC streak, and each maps to a quarterback era — the pattern the QB-continuity data would predict.
The Honest Read: The Crown Is a Receipt, Not a Forecast
Repeating beats chance, and that's all. 42.9% ± 3.7% is 1.7× the random-member baseline of 25% — winners are genuinely better teams, and better teams stay better. But the same 184 defenses put the champ in last place 23 times (12.5% ± 2.4%), and the average winner falls from 11.5 wins per 16 games to 9.4 — two full wins of regression. The streaks data made this point about game sequences; this is the season-level version.
How the title was won tells you nothing about keeping it. By title margin, the gradient never materializes: tiebreaker titles repeat at 50.0% (11/22, ±10.7), one-game margins at 40.0% (20/50, ±6.9), two-game margins at 29.3% (12/41, ±7.1), blowout titles of 2.5+ games at 50.7% (36/71, ±5.9). Collapsed to thin (≤1 game) versus comfortable (≥1.5): 43.1 ± 5.8 against 42.9 ± 4.7 — identical.
And the crown itself predicts almost nothing beyond the record. This is the load-bearing test. Match every division winner against non-winners from the same season with the same win total (58 matched cells, 2002–24) and the winners' next season comes out +0.05 in win percentage — +0.9 wins per 17, bootstrap SE ±0.5. A regression of next-season W% on this-season W% plus a crown dummy agrees: crown coefficient +0.034 (SE 0.021), under two standard errors from zero. The raw gap — winners take next year's title 42.9% of the time versus 19.0% for everyone else — is the record talking: matched on exact record, the next-title difference (+11.5 points, SE ±9.1) is noise too. A division title is evidence you were good; it is not additional evidence you'll stay good.
Worst-to-first is roughly an annual event. Next season's winner had finished last in 32 of 184 division-seasons (17.4% ± 2.8; sole-possession variant: 24, 13.0% ± 2.5). The only blank seasons are 2014, 2019, and 2024; three seasons produced three apiece — 2005, 2006, and 2025. Per team, a cellar-dweller has a 15.5% shot at first against a 38.2% chance of staying last.
Worked Examples, Straight from the File
- The 16-of-17 empire, and the one that got away. New England won the AFC East 16 times in 17 seasons, 2003–2019. The miss: in 2008 the Patriots went 11-5 and lost the division to 11-5 Miami on the conference-record tiebreaker — Miami arriving via the window's most violent worst-to-first, 1-15 to champion in one year.
- The reign that ended at 6-11. Kansas City won nine straight AFC Wests (2016–2024), then didn't so much hand the crown over as drop it down a stairwell: 6-11 in 2025, while 14-3 Denver — the team KC dethroned in 2016 — took the division.
- Worst-to-first goes deep. Two of the 32 jumped all the way to the Super Bowl: 2017 Philadelphia (last at 7-9, then 13-3 and a 41-33 win over New England) and 2021 Cincinnati (last at 4-11-1, then 10-7 and a 23-20 loss to the Rams).
- Losing records defend titles, too. The window holds five sub-.500 champions — 2010 Seattle (7-9), 2014 Carolina (7-8-1), 2020 Washington (7-9), 2022 Tampa Bay (8-9), 2025 Carolina (8-9) — and of the four with a completed next season, two repeated (Carolina 2015, Tampa Bay 2023).
2025 Was a Purge Year — and the 2026 Schedule Knows It
2025 replaced seven of eight division winners — only Philadelphia repeated — and tied the window record with three worst-to-first champions: New England (4-13 to 14-3), Chicago (5-12 to 11-6), and Carolina (5-12 and tied-last to 8-9, winning a three-way 8-9 tiebreaker on head-to-head). Carolina defends the shakiest crown of 2026; history's comfort is that tiebreaker titles repeated at 50% and sub-.500 champs went 2-for-4.
The schedule-makers noticed. 2026 opens Wednesday, September 9: New England at Seattle — a worst-to-first champion visiting the defending Super Bowl winner. On September 13, Chicago plays at Carolina: two of the three worst-to-first champs handed each other in Week 1. And on Monday night, September 14, Denver opens at Kansas City — the reign-ender sent straight back into the building. Each champion enters as a 43% proposition to repeat, and the Week 1 data says the opener will barely move that number.
Honest Limitations
- The standings are derived, not transcribed. The tiebreaker chain runs only as deep as a game log allows (through strength of schedule, net points as a never-used backstop). It matches all 23 official tiebreaker titles in the window, but the NFL's full procedure goes deeper (points-rank steps, a coin flip), so a future edge case could in principle diverge.
- The window is a choice. Before 2002, divisions had five and six teams and "last place" meant something different. The cost is sample size: ±3.7 points on the headline rate, ±6–11 on the margin bins.
- Last-place ties are counted as co-holders (207 last-place teams in 184 division-seasons); the sole-possession variant (13.0%) is quoted alongside. Neither changes the story.
- The crown test is observational. Matching on win total controls the record, not the roster — equal-record teams can differ in point differential, health, and schedule. The +0.9-win estimate is a generous read of what the banner adds, and it still can't clear two SEs.
- 16- and 17-game seasons are mixed. Wins are normalized per 16 throughout, and matched comparisons never cross a season boundary.
How to Actually Use This
- Price the champ off its record, not its banner. Futures markets love the word "defending." The title itself adds under a win, within noise of zero.
- Budget two wins of regression. The average champion drops from 11.5 to 9.4 wins per 16; a 12-win winner projected at 12 again is arguing with 184 precedents.
- Take "somebody goes worst-to-first" seriously and "this specific somebody" skeptically. A cellar team jumped in 20 of 23 seasons, but any given one converts 15.5% of the time.
- Ignore title margin. Tiebreaker champs repeated as often as blowout champs (50.0% vs 50.7%). "They barely won it" is commentary, not information.
Reproduce It
One public file: games.csv from nflverse nfldata, bundled at /data/games.csv. The standings derivation, tiebreaker chain, and chart live in explainer_src/make_division_repeat_chart.py. The core:
import pandas as pd, numpy as np

df = pd.read_csv("https://nflanalytic.com/data/games.csv")
df[["home_team","away_team"]] = df[["home_team","away_team"]].replace(
    {"SD":"LAC","STL":"LA","OAK":"LV"})          # franchise continuity
g = df.dropna(subset=["home_score"])
g = g[(g.game_type == "REG") & g.season.between(2002, 2025)]   # 6,223 games

h = g.rename(columns={"home_team":"team","home_score":"pf","away_score":"pa"})
a = g.rename(columns={"away_team":"team","away_score":"pf","home_score":"pa"})
cols = ["season","team","pf","pa"]
tr = pd.concat([h[cols], a[cols]])
tr["res"] = np.where(tr.pf > tr.pa, 1.0, np.where(tr.pf < tr.pa, 0.0, 0.5))
wl = tr.groupby(["season","team"]).res.mean()    # W% incl. ties as half

# rank inside each (season, division); ties then go to the official
# chain: h2h -> division -> common games -> conference -> SOV -> SOS,
# with the multi-club restart rule (see make_division_repeat_chart.py).
# Repeat rate = P(winner(s+1, div) == winner(s, div)) over 184 pairs.
All figures were computed 2026-08-06 on the 2002–2025 file (the 272 scoreless 2026 rows drop out of the played-games filter). SEs are binomial √(p(1−p)/n); crown-vs-record SEs are seeded 4,000-draw bootstraps over matched cells. The historical rows will not change; the 2026 section will age with the season.
Data: nflverse/nfldata, public. Window 2002–2025 (post-realignment, 8×4 divisions); standings derived from game results via the official tiebreaker chain, verified against all 23 official tiebreaker titles; last place = worst W%, ties co-hold; wins normalized per 16 games; SD→LAC, STL→LA, OAK→LV mapped throughout.
Go deeper
Want the code behind these metrics? Work through the 45-chapter NFL analytics tutorial.
Browse tutorials Free tools