The Premise: Predictions You Can Audit
This site has spent sixty explainers being rude about predictions — openers that predict less than claimed, close-game heroics that evaporate, preseason schedule strength that barely survives contact with September. So publishing weekly game predictions needs a justification, and here it is: the problem with football picks isn't that they exist, it's that they're untracked. A pundit's Tuesday certainty disappears by Sunday night; a model's probability, frozen at publication and graded in public, is the opposite of that. Starting with the 2026 season, the predictions page states a win probability for every game, locks it before kickoff, attaches the result after, and keeps the running score — misses included — all season. This page is the model's job interview: what it is, exactly, and how it did on sixteen seasons it had never seen.
The Model, Fully Stated
Every team carries a rating that starts at 1505 in 1999 and updates after every game in the bundled nflverse game log, playoffs included. There are exactly four moving parts, and this paragraph is all of them. Win probability: home probability is 1 / (1 + 10−(elo diff + 48)/400) — the 48 is the home edge, worth about seven points of win probability to an even matchup, and it is not applied when the schedule file marks a game neutral-site. Update: after each game both ratings move by K = 20 times the gap between the result and the stated probability, so an upset moves ratings more than a formality. Margin: the move is scaled by ln(margin + 1), discounted when the winner was already the big favorite — running up the score buys less than winning at all. Seasons: each offseason, every rating regresses one-third of the way back to 1505, which is the model saying "rosters change and I can't see it."
That last clause is the important honesty. The model reads final scores and nothing else. It does not know who the quarterback is — which we've measured to matter enormously — who got hurt in August, or what any roster did all spring. When it publishes its Week 1 numbers it is expressing franchise-level momentum plus a haircut, not an opinion about anyone's depth chart. That costs accuracy, and buys something we value more: not one number on the page can be quietly nudged by a human with a feeling.
The Exhibit: Sixteen Seasons, Walked Forward
The backtest replays history in strict date order — for each game the model predicts from ratings built only on earlier games, then updates. 1999–2009 is burn-in for the ratings to find their level; 2010–2025 is graded. The engine that produced this chart is byte-for-byte the script that generates the live weekly numbers; there is no separate, kinder scoring path.
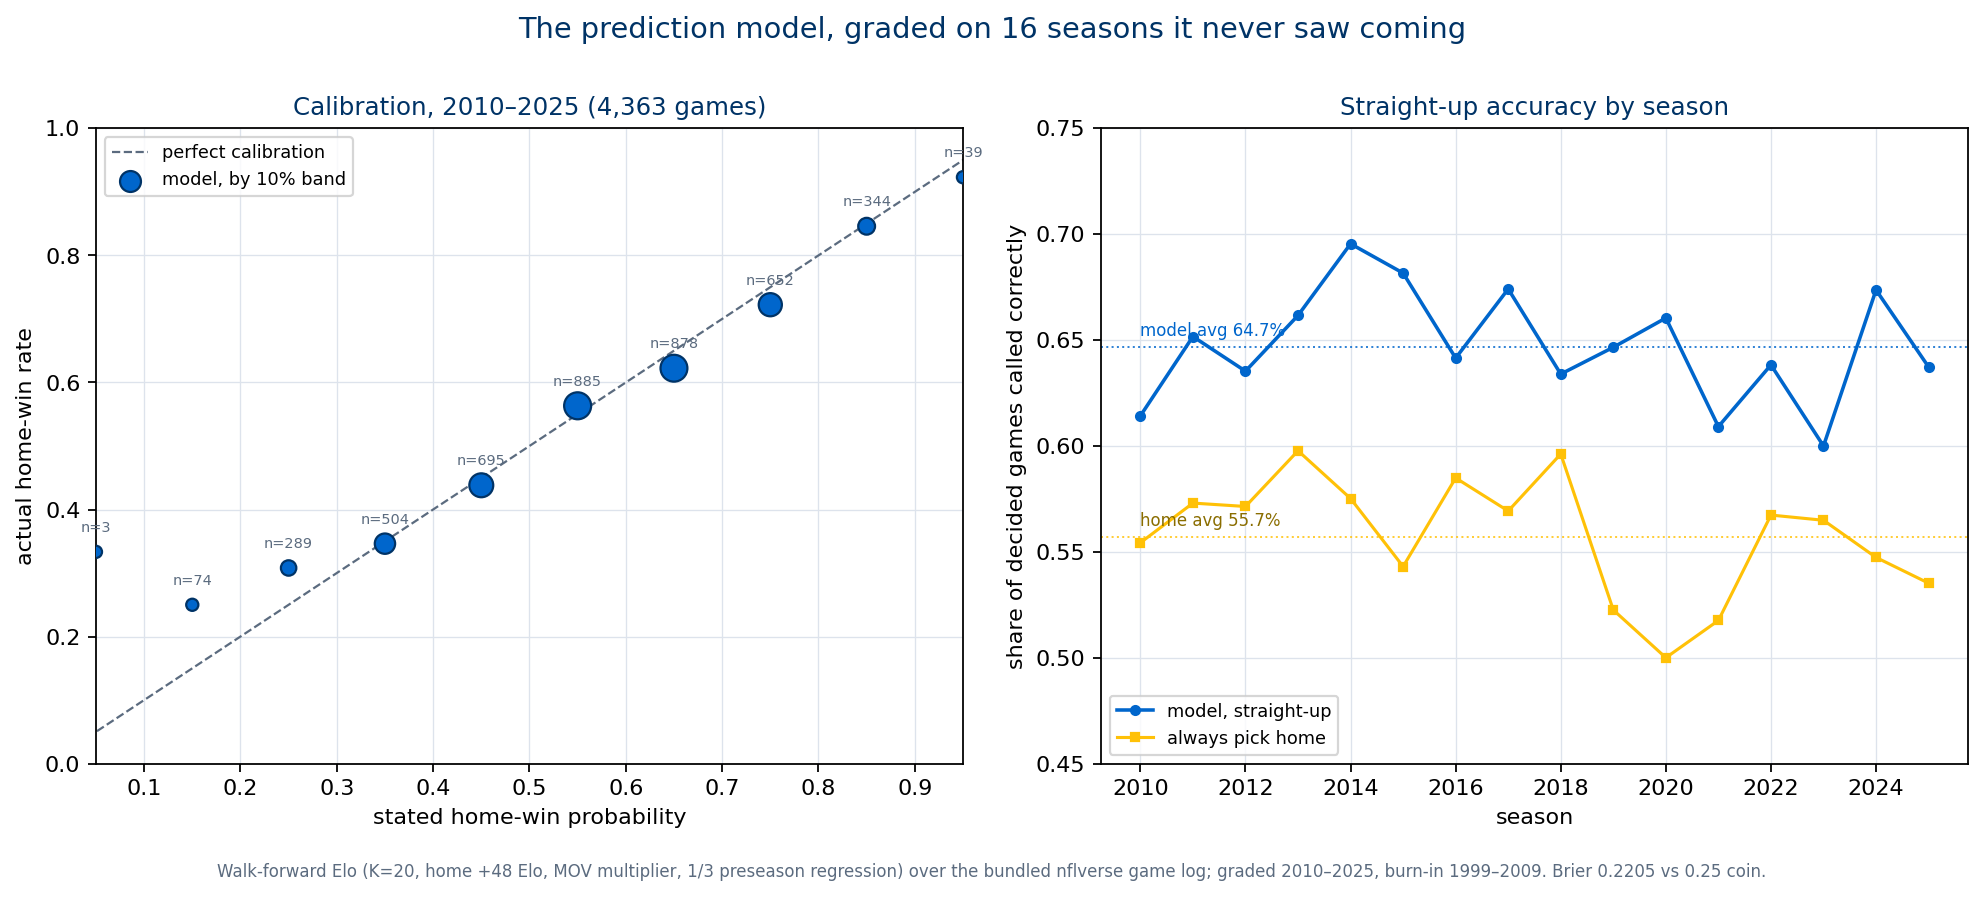
Read the calibration panel first; it's the one that separates a probability from a vibe. In the 885 games where the model said the home side was a 50–60% favorite, home won 56.3%. Told-you-so territory is thin at the edges — only 39 games ever earned a stated probability above 90% (the home team won 92% of them), and the three games below 10% are too few to grade. The one visible wobble is real and disclosed: in the 74 games rated 10–20%, home teams won 25.0%, about ten points above the band — heavy home underdogs have outperformed the model's contempt, on a sample small enough that the gap is not yet distinguishable from noise.
The Grading, Against Baselines That Don't Think
| Forecaster | Straight-up accuracy | Brier score |
|---|---|---|
| The model (walk-forward Elo) | 64.7% | 0.2205 |
| Pick the better prior-season record | 58.4% | — |
| Always pick the home team | 55.7% | — |
| A coin | 50% | 0.2500 |
4,350 decided games, 13 ties (ties are excluded from accuracy, count half in Brier). Brier score is the average squared gap between stated probability and outcome — lower is better, and it punishes confident wrongness hardest, which is the correct thing to punish.
The season-by-season floor and ceiling are the expectation-setting numbers: the model's best graded year was 2014 (69.5%), its worst 2023 (60.0%), and nothing in its construction prevents 2026 from landing at either end. What the sixteen years do rule out is the seductive version of this feature — the one where a model is presented as an oracle. Roughly 35% of NFL games are won by the side this fully-informed-about-nothing rating system had as the underdog. Any week now, that will include a game this site's model was loud about. The scoreboard will show it, because the scoreboard shows everything.
What this is not. It is not betting advice, and the bar it clears is not the betting bar. Beating the closing spread requires beating a forecast that misses final margins by about 10 points but misses them fairly — a market that already ate every public model's information, this kind included. Our claim is smaller and checkable: stated probabilities, honest calibration, public grading. For the season-long structural reads that don't need a weekly number — rest edges, records versus teams — the rest of the site is already there.
The ledger rules. Week 1's sixteen probabilities were generated and locked on August 12 from the post-regression 2025 ratings (Seattle enters at 1675, the league's highest; the model's first loud call is Denver favored at Kansas City on the Week 1 Monday night, 58–42). A published number is never edited; a missed week stays missed rather than being backfilled; results attach as they happen; and the full ledger is served raw as JSON and CSV so anyone can re-grade us without asking permission.
Sources: nflverse public game log (data/games.csv, 1999–2025 plus the 2026 schedule). Model, backtest, and ledger are generated by nfl_elo.py in the site build; constants K=20, home edge 48, base 1505, preseason regression 1/3. No hand-entered numbers.
Go deeper
Want the code behind these metrics? Work through the 43-chapter NFL analytics tutorial.
Browse tutorials Free tools