One Number Per Team, Before a Snap Is Played
This site's prediction model carries one frozen opening rating for every team into 2026, and the ledger has already turned those ratings into win probabilities for all 16 week-1 games. This page runs the same arithmetic through the whole season: for each team, take its actual 17-game schedule from the file, compute the model's win probability for every game exactly as the ledger does — a logistic curve in the rating gap, plus a 48-point Elo home edge that's waived for the Melbourne neutral-site game — and add the probabilities up. The sum is the team's expected wins: the average of its 2026 record across every way the season could unfold, if the opening ratings are right.
Because every game hands out exactly one win, the 32 totals sum to 272 — the number of games on the schedule. No number here is an opinion: all of it is a deterministic function of the published ratings and the schedule file, and you can rebuild the whole table from the last section.
The Exhibit: All 32 Expectations, Ranked
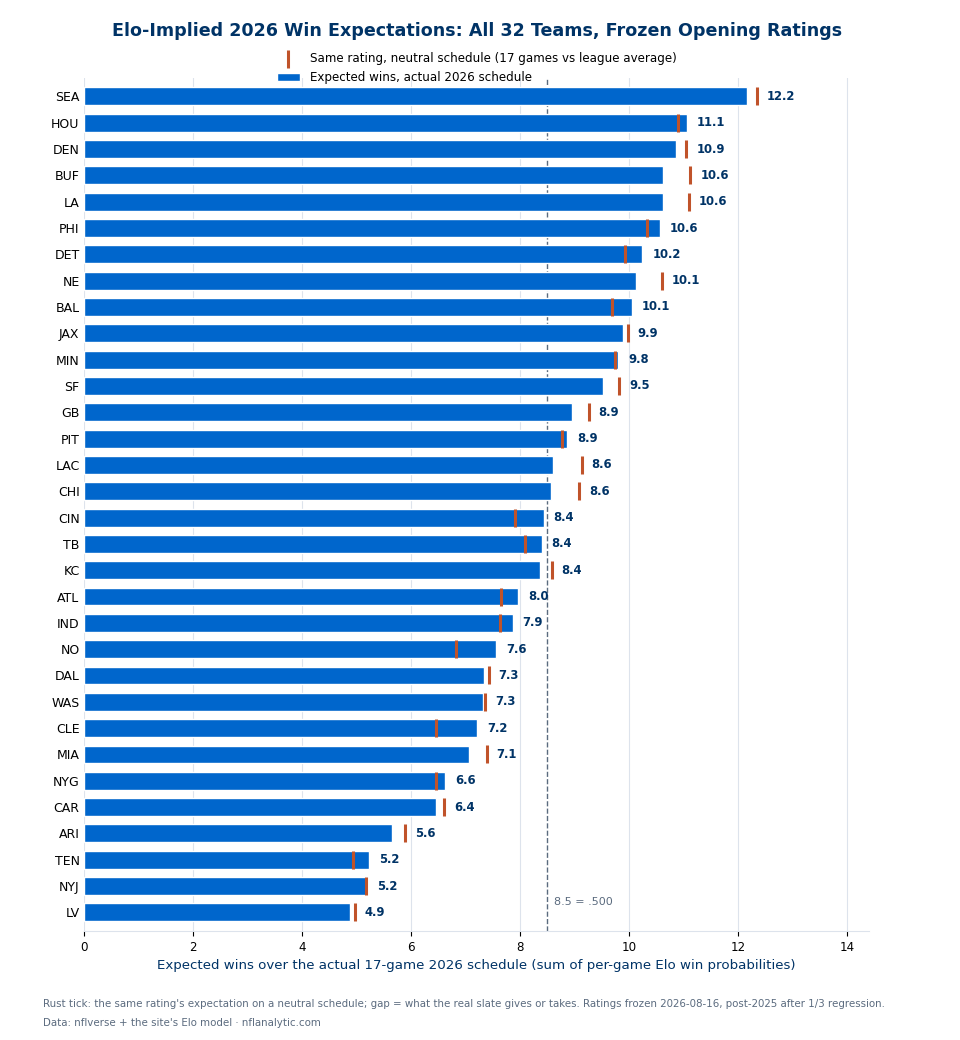
The full table, sortable by eye. Neutral is the same rating's expectation over a hypothetical schedule of 17 league-average opponents on neutral fields; bend is expected wins minus that — what the real slate, home split included, gives or takes:
| # | Team | Opening Elo | Expected wins | Neutral | Bend |
|---|---|---|---|---|---|
| 1 | Seattle | 1674.6 | 12.17 | 12.35 | −0.18 |
| 2 | Houston | 1605.6 | 11.06 | 10.89 | +0.17 |
| 3 | Denver | 1612.6 | 10.86 | 11.05 | −0.19 |
| 4 | Buffalo | 1615.9 | 10.63 | 11.12 | −0.50 |
| 5 | L.A. Rams | 1614.7 | 10.62 | 11.10 | −0.48 |
| 6 | Philadelphia | 1581.2 | 10.57 | 10.34 | +0.23 |
| 7 | Detroit | 1563.9 | 10.24 | 9.93 | +0.32 |
| 8 | New England | 1592.8 | 10.12 | 10.60 | −0.48 |
| 9 | Baltimore | 1553.4 | 10.06 | 9.68 | +0.38 |
| 10 | Jacksonville | 1565.9 | 9.88 | 9.97 | −0.09 |
| 11 | Minnesota | 1556.1 | 9.80 | 9.74 | +0.06 |
| 12 | San Francisco | 1559.4 | 9.52 | 9.82 | −0.30 |
| 13 | Green Bay | 1535.9 | 8.95 | 9.25 | −0.31 |
| 14 | Pittsburgh | 1516.0 | 8.87 | 8.77 | +0.10 |
| 15 | L.A. Chargers | 1530.9 | 8.61 | 9.13 | −0.52 |
| 16 | Chicago | 1528.7 | 8.57 | 9.08 | −0.51 |
| 17 | Cincinnati | 1480.4 | 8.43 | 7.90 | +0.53 |
| 18 | Tampa Bay | 1488.4 | 8.40 | 8.09 | +0.30 |
| 19 | Kansas City | 1508.2 | 8.37 | 8.58 | −0.21 |
| 20 | Atlanta | 1470.3 | 7.96 | 7.65 | +0.31 |
| 21 | Indianapolis | 1469.4 | 7.86 | 7.63 | +0.23 |
| 22 | New Orleans | 1435.3 | 7.56 | 6.82 | +0.74 |
| 23 | Dallas | 1460.7 | 7.33 | 7.42 | −0.09 |
| 24 | Washington | 1458.2 | 7.32 | 7.36 | −0.04 |
| 25 | Cleveland | 1419.9 | 7.21 | 6.46 | +0.75 |
| 26 | Miami | 1459.1 | 7.05 | 7.38 | −0.33 |
| 27 | N.Y. Giants | 1419.3 | 6.62 | 6.45 | +0.18 |
| 28 | Carolina | 1426.3 | 6.44 | 6.61 | −0.16 |
| 29 | Arizona | 1394.4 | 5.64 | 5.88 | −0.24 |
| 30 | Tennessee | 1349.8 | 5.23 | 4.94 | +0.29 |
| 31 | N.Y. Jets | 1361.5 | 5.19 | 5.18 | +0.01 |
| 32 | Las Vegas | 1351.0 | 4.87 | 4.96 | −0.09 |
The Spread Is Only 7.3 Wins, and That's the Point
The gap from Seattle's 12.2 to Las Vegas's 4.9 is 7.3 expected wins — narrower than an actual NFL season ever finishes, where someone usually wins 14 and someone wins 2 or 3. That compression is deliberate. The model regressed every rating one third of the way to the mean after 2025, because that's what its 16-season backtest said keeps it honest: last year's 14-win team is, on average, not a 14-win team now. Expected wins are a central tendency, not a ceiling; extreme final records happen when a good team also lands on the right side of its coin flips. Note also the compression at the bottom of the rating sheet: Tennessee owns the lowest opening rating (1349.8), but its schedule (+0.29 wins) lifts it just past Las Vegas and the Jets, so the last three places are separated by a third of a win.
Kansas City is the starkest single row: after nine straight division titles, its post-2025 rating sits at 1508.2 — essentially league average — for 8.4 expected wins, nineteenth. That is what the 2025 scores, regression applied, actually imply; the close-game-luck page explains why the model refuses to remember reputations.
What This Is Not: A Market Win Total
Sportsbooks publish 2026 win totals too, and this page deliberately quotes none of them. The numbers above are the model's — one rating system, built from final scores only. It has never heard of a quarterback change, a holdout, or an injury report; a market number bakes in all of that plus the flow of money. When this table and a betting board disagree, the gap is information about what scores-only history cannot see, not an inefficiency to bet on.
The second honest caveat is noise. Even if every opening rating were exactly right, a 17-game season is 17 weighted coin flips: the binomial standard deviation, sqrt(Σ p(1−p)), works out to 1.8–2.0 wins for every team on this slate. Read the table as "about 10 wins, give or take 2" — roughly one season in three lands further out than that, and rating error sits on top of the coin flips. Regression to the mean is already inside the ratings; randomness never regresses.
Where the Schedule Bends the Number
Because every team's expectation is summed over its actual opponents and venues, the schedule's push is directly computable: compare each team's expected wins to the same rating's neutral baseline. The real slate is worth +0.75 wins to Cleveland and +0.74 to New Orleans, with Cincinnati third at +0.53. It costs the Chargers 0.52 wins, Chicago 0.51, and Buffalo 0.50. That half-win is exactly why the rating order and the expectation order disagree up top: Buffalo opens second in rating but fourth in expectation, while Houston, fifth in rating, climbs to second on the softest schedule among the contenders (+0.17). The bend folds in three things at once: opponent quality, the 9-home/8-away split (worth roughly a quarter of a win by itself at 48 Elo points per home game), and Melbourne, where San Francisco and the Rams each surrender one home edge to a neutral site. The full schedule-difficulty picture — who plays whom, rest gaps, why August SOS numbers lie — lives on the 2026 schedule-strength page; this page only prices the bend in wins.
The Season Grades This Table Weekly
These 32 numbers are falsifiable, and the machinery to grade them already runs. Every week of 2026, the prediction ledger freezes a win probability for each game before kickoff and attaches the real result after — the same ratings, the same formula, never edited, misses kept on the page. By January the ledger's graded rows are the audit of this table. The methodology, the 64.7% backtest accuracy, and the Brier scores it must answer to are stated once on the prediction-model page — nothing on this site predicts from feel, and nothing predicted is ever quietly revised.
Honest Limitations
- One rating system. Everything above flows from a single Elo built on final scores. Different systems produce different tables; this one's virtue is that it is fully stated, backtested, and graded in public — not that it is uniquely right.
- Rosters are invisible. The ratings know 2025's scores and nothing since: no trades, draft picks, or August injuries. A team transformed this offseason is exactly where its old scores left it.
- ±2 wins of pure luck. The binomial noise on a 17-game season is 1.8–2.0 wins per team before any rating error. A team finishing two wins off its expectation has told you almost nothing.
- Expectations are not predictions of a record. 8.4 expected wins does not mean the model predicts 8-9; it is the mean of many simulated seasons, most of which don't land on their mean.
- The schedule can move. Flexed games don't change opponents, but any venue or format change (another neutral site, say) would shift the affected totals by a few hundredths.
Reproduce It
Two public files, bundled on this site: the frozen ratings in /data/predictions.json and the schedule in /data/games.csv. The whole table is a dozen lines:
import json, csv

R = json.load(open("predictions.json"))["ratings"]          # 32 frozen ratings
rows = [r for r in csv.DictReader(open("games.csv"))
        if r["season"] == "2026" and r["game_type"] == "REG"]   # 272 games

exp = {t: 0.0 for t in R}
for r in rows:
    h, a = r["home_team"], r["away_team"]
    edge = 0 if r["location"] == "Neutral" else 48              # the home edge
    p = 1 / (1 + 10 ** (-((R[h] + edge) - R[a]) / 400))
    exp[h] += p
    exp[a] += 1 - p

for t in sorted(exp, key=exp.get, reverse=True):
    print(t, round(exp[t], 2))          # SEA 12.17 ... LV 4.87 (sums to 272)
The chart, the binomial SDs, and the neutral-schedule baseline come from explainer_src/make_win_totals_chart.py. All figures on this page were computed 2026-08-16 from the ratings frozen that day; when the ledger updates in-season, the opening expectations here stay as published — they are the before-the-season claim being graded.
Data: nflverse/nfldata (public schedule and results) + the site's Elo model, stated in full on the prediction-model page. Nothing here is hand-entered, and no market odds are quoted.
Further Reading
- The prediction model, fully stated — the Elo formula, constants, and the 4,363-game walk-forward backtest these expectations inherit.
- The 2026 prediction ledger — the frozen weekly probabilities that will grade this table, game by game.
- The 2026 strength of schedule — whose slate is hardest on paper, and how much August SOS numbers lie.
- Pythagorean wins — the older cousin: expected wins from points scored and allowed, and why differential beats record.
- One-score records are luck — why last year's clutch record is priced at nothing here.
- The 2026 season hub — every preview, tracker, and division page in one place.
Go deeper
Want the code behind these metrics? Work through the 43-chapter NFL analytics tutorial.
Browse tutorials Free tools