The Question: Does August Football Mean Anything?
Every August a 3-0 preseason turns into a "sneaky sleeper" column and an 0-3 turns into a panic thread. Both takes are checkable — but not from the usual file. The nflverse game log this site runs on carries regular-season and postseason games only, so for this page we pulled every completed preseason game from ESPN's public scoreboard feed, seasons 2015 through 2025: 567 games, normalized to the same franchise codes as the rest of the site. Joined to the regular seasons that followed, that's 320 team-seasons (ten seasons of 32 teams — 2020 had no preseason at all) with a preseason record on one side and a real record on the other.
The Exhibit: A Non-Predictor Next to a Real Predictor
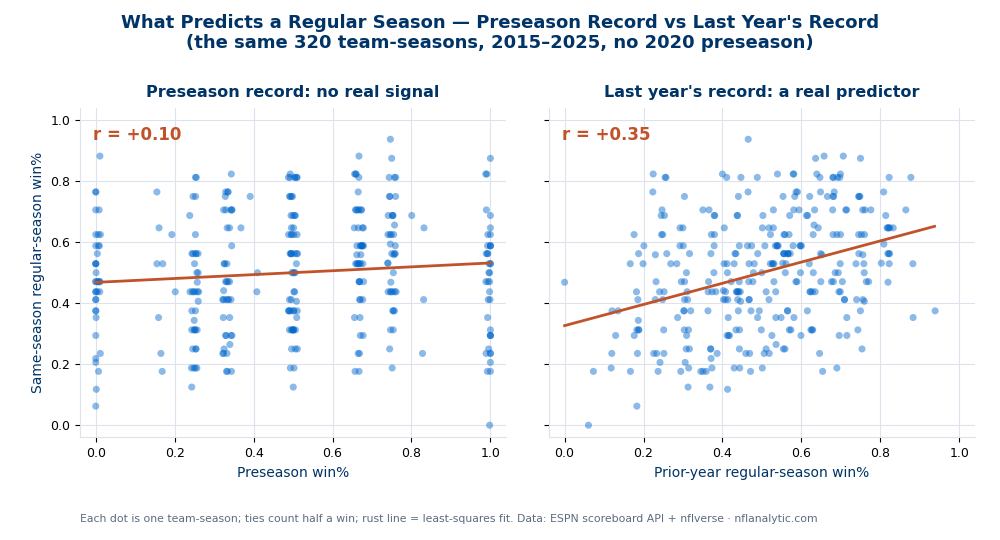
The fair test needs an anchor. "r = +0.10" means little on its own, so the chart puts the same 320 team-seasons through two lenses: preseason record on the left, and the most ordinary forecast in sports — last year's regular-season record — on the right. Same teams, same axes, same fit.
| Predictor of regular-season win% | r | r² (variance explained) | n |
|---|---|---|---|
| Preseason win%, same year | +0.10 | 1.0% | 320 |
| — 2015–2019 era only (4 preseason games) | +0.21 | 4.4% | 160 |
| — 2021–2025 era only (3 preseason games) | +0.008 | 0.0% | 160 |
| Prior-year regular-season win% (the anchor) | +0.35 | 12.2% | 320 |
The anchor matters because it is such a low bar. A team's previous record is a famously mediocre forecast — point differential beats it, and everything regresses — yet it still carries twelve times the variance preseason record does. And the era split is the sharpest fact on the page: in the four-game era the exhibitions carried a faint pulse (+0.21); since the 2021 schedule change cut the preseason from four games to three and starters all but vanished from them, the pulse is gone. +0.008 over 160 team-seasons is what a coin flip looks like.
The Extremes: What 3-0 and 0-3 Actually Bought
Averages can hide a signal in the tails, so take the tails alone. Thirty-nine of the 320 team-seasons finished the preseason unbeaten; thirty-eight finished it winless. Here is what happened to them:
| Preseason result | Team-seasons | Avg regular-season W% | Made playoffs |
|---|---|---|---|
| Unbeaten (3-0, 4-0, or 5-0) | 39 | .466 | 33.3% (13) |
| Winless (0-3, 0-4, or 0-5) | 38 | .472 | 39.5% (15) |
| All 320 team-seasons | 320 | .500 | 40.6% (130) |
Read that twice: the perfect-preseason teams finished with a worse average record than the winless ones (a 7.9-win pace per 17 games versus 8.0), and made the playoffs less often. Restricting to the modern era makes it stranger still — among 2021–2025 teams that played exactly three games, the 3-0 teams finished .460 with 8 of 24 in the playoffs, and the 0-3 teams finished .478 with 10 of 24. None of these gaps clears noise; that is the point. The tails carry nothing.
The individual fates are the best inoculation September has to offer. The 2017 Browns swept their preseason 4-0 — and went 0-16, the only winless 16-game season in the sample. The 2022 Bears and 2024 Titans both went 3-0 and finished 3-14. On the other side, the 2019 Ravens went 4-0 and delivered 14-2, and the 2024 Vikings and 2025 Broncos turned 3-0 Augusts into 14-3 seasons. A perfect preseason preceded both the best and the very worst seasons in the file, which is exactly what "1% of the variance" looks like in the wild.
Why the Signal Is So Weak
- Nobody is trying to win the same game. Preseason outcomes are decided mostly by players who will be cut or buried on the depth chart within weeks. A fourth-quarter comeback by a roster-bubble quarterback tells you about the 53rd roster spot, not the season. This has always been true, but the era split shows it getting truer: starters' preseason snaps have collapsed league-wide, and since 2021 many starting units never appear at all.
- The sample is tiny even if the games were honest. Three games of a true .500 coin produce records of 3-0 or 0-3 a quarter of the time. With so few games, a team's preseason win% takes only four possible values — the measurement is coarse before you even ask whether it measures anything.
- The schedule change made it worse on both counts. When the league moved to 17 regular-season games in 2021, the preseason dropped from four games (plus the Hall of Fame game) to three. Fewer games, fewer starter snaps — and the correlation went from a faint +0.21 to +0.008.
- What preseason results genuinely reflect — depth, coaching of backups, joint-practice temper — is real but worth almost nothing against 17 games decided by the top of the roster. The anchor column exists to show the difference: information about the actual starters (last year's record) survives into +0.35 even across an offseason of roster churn.
Honest Limitations
- The dataset is a different source than the rest of the site. Preseason games are absent from the nflverse game log, so they were pulled from ESPN's public scoreboard API (completed games only) and normalized to the same franchise codes (SD→LAC, STL→LA, OAK→LV, WSH→WAS). Regular-season records still come from the nflverse file. Per-season counts land exactly on the known calendar: 65-65-64-64-65 for 2015–2019 and 48–49 for 2021–2025, the shortfalls being real cancellations — the 2016 Hall of Fame game (field conditions), a 2017 Cowboys–Texans game (Hurricane Harvey), and the Saints–Cardinals 2021 finale (Hurricane Ida).
- 2020 is missing by history, not by us. The COVID year had no preseason; the feed correctly returns zero games, and 2020 team-seasons are excluded from the join.
- Correlation on a coarse variable is attenuated. With 3–5 preseason games, measurement noise alone would drag a true signal toward zero. That softens the verdict on the underlying quality signal — but not on the practical one: the observable preseason record is the only thing a September take can use, and it explains 1% of anything.
- Ties and eras. Ties count half a win on both sides of the join (preseason games can and do end tied). The sample pools 16- and 17-game regular seasons and 12/14-team playoff fields; the base playoff rate of 40.6% blends both.
- This page owns August; other pages own September. Once real games start, the evidence changes character: winning the opener genuinely doubles playoff odds, though the opener predicts no better than any other single game — that full accounting lives in the Week 1 signal explainer and is not re-derived here.
How to Actually Use This
- Price August at zero. A 3-0 preseason moved the average team's subsequent record nowhere. If a preseason performance changes your view of a team, make sure it's the film of specific starters in their limited snaps doing it — the scoreboard itself carries no information you can use.
- Prefer any real predictor. Last year's record — the weakest serious forecast available — is twelve times more informative. Point differential and close-game regression do better still.
- This is why our model ignores the preseason entirely. The site's 2026 predictions and their graded ledger take nothing from preseason games: the Elo model carries each team's rating across the offseason with one-third regression to the mean and waits for real games. Preseason results never touch a rating and never will — the +0.008 row in the table above is the reason.
- Beware the annual counterexample. Every few years an unbeaten August team wins big in the fall (2019 Ravens, 2025 Broncos) and the takes write themselves. The base above says the same August also produced 0-16 — survivorship does the rest.
Related machinery on this site: the Week 1 signal (what the first real game is worth), the 2026 preseason tracker (what actually happened this August, no predictions attached), and the prediction model (what this site does use).
Reproduce It
Two files: preseason.json (built by data_layer/build_preseason.py from ESPN's public scoreboard feed, seasontype 1, completed games only, served at /data/preseason.json) and the nflverse games.csv (served at /data/games.csv). Compute each team-season's preseason win% from the first, its regular-season win% from the second, join, and correlate. The chart and full console breakdown come from explainer_src/make_preseason_signal_chart.py; the core:
import json, csv, collections, urllib.request
import numpy as np

pre = json.load(urllib.request.urlopen("https://nflanalytic.com/data/preseason.json"))["games"]
SEASONS = [y for y in range(2015, 2026) if y != 2020]

def winshare(acc, key, w):
    acc[key][0] += w; acc[key][1] += 1

ps = collections.defaultdict(lambda: [0.0, 0])
for g in pre:
    if g["season"] not in SEASONS: continue
    hw = 1.0 if g["home_score"] > g["away_score"] else (
         0.5 if g["home_score"] == g["away_score"] else 0.0)
    winshare(ps, (g["season"], g["home"]), hw)
    winshare(ps, (g["season"], g["away"]), 1 - hw)

reg = collections.defaultdict(lambda: [0.0, 0])   # same, from games.csv REG rows
# ... (identical accumulation; SD/STL/OAK aliased to LAC/LA/LV)

rows = [(ps[k][0]/ps[k][1], reg[k][0]/reg[k][1],
         reg[(k[0]-1, k[1])][0]/reg[(k[0]-1, k[1])][1]) for k in sorted(ps)]
p, r, prior = map(np.array, zip(*rows))
print(len(rows))                          # 320
print(np.corrcoef(p, r)[0, 1])            # +0.100
print(np.corrcoef(prior, r)[0, 1])        # +0.350
All figures on this page were computed 2026-08-15 on the 2015–2025 pull (567 completed preseason games; the in-progress 2026 preseason is excluded from the study by construction). Numbers will shift trivially if ESPN restates a historical score, and 2026 joins the sample once its regular season is played.
Data: ESPN public scoreboard API (preseason, completed games only) + nflverse/nfldata (regular seasons). Ties count half a win throughout; 2020 excluded (no preseason was played); franchise relocations normalized to current codes.
Go deeper
Want the code behind these metrics? Work through the 43-chapter NFL analytics tutorial.
Browse tutorials Free tools