One Landlord at a Time
Since the 2002 realignment, the AFC East has crowned a champion 24 times — and handed the title to the same two franchises in 22 of those 24 seasons. New England owns 17 crowns, including 11 straight from 2009 through 2019; Buffalo owns the five from 2020 through 2024; the only interruptions are a pair of tiebreakers — the Jets in 2002 (a three-way knot resolved on common games) and Miami in 2008. The champion repeated in 18 of 23 transitions (78.3%), against a league-wide rate of 42.9% — the division-repeats page owns that league-wide story, and this page's standings derivation imports its code path, so the two can never disagree on a champion.
That's the frame for a 2026 preview with no predictions in it: the AFC East is the league's most monopolized division and, by every margin-based measure in the file, its least close round-robin. The forecasting itself lives at the predictions page, not here.
The Exhibit: 24 Years of Division Wins, Champions Outlined
For each club and each season 2002–2025, count wins in that team's six games against the other three; outline the division champion's cell in amber. The standings under the outlines are computed from the game file itself, via the official tiebreaker chain:
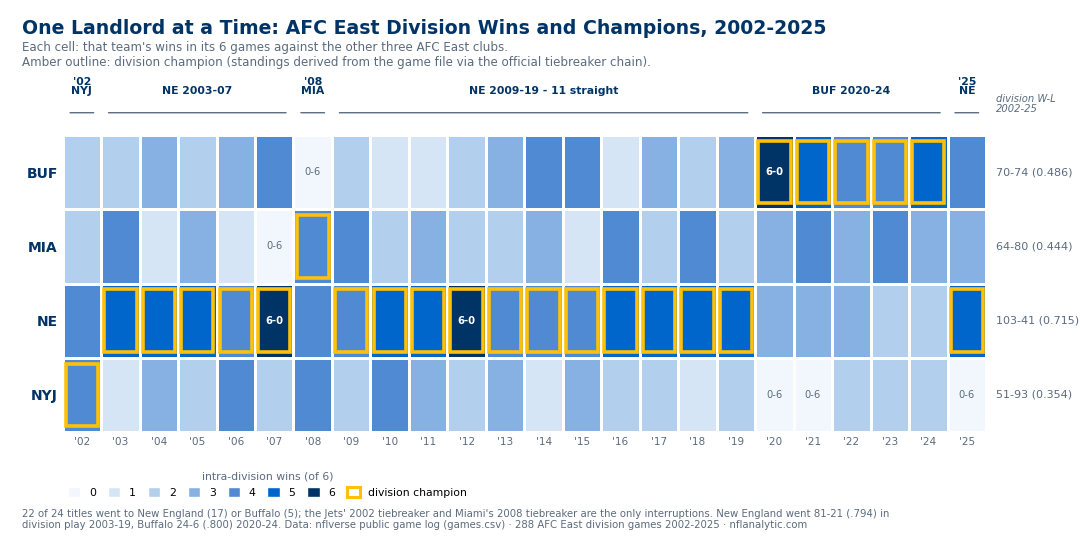
The 24-year totals are feudal. New England went 103-41 (.715) in division play across the window; Buffalo is next at 70-74 (.486), then Miami at 64-80 (.444) and the Jets at 51-93 (.354). Slice by era and the landlord metaphor gets literal: New England went 81-21 (.794) against its own division from 2003 through 2019; Buffalo answered with 24-6 (.800) from 2020 through 2024; in 2025 New England took the keys back at 5-1 to Buffalo's 4-2. The other side of the grid is just as lopsided — the Jets went 6-30 (.167) in division play from 2020 through 2025 and have finished last (ties co-held) 11 times in 24 seasons; New England has done so twice.
The League's Least Close Round-Robin
Each division has played exactly 288 intra-division games since 2002, which makes the comparison clean. The AFC East's average absolute margin is 13.08 points — widest of the eight, nearly a field goal beyond the NFC North's league-best 10.32. Only 44.4% of its division games were decided by one score (eight points or fewer); every other division clears 47.9%, the NFC North sits at 54.9%. At the other tail, 39.6% were decided by 14 or more — also the league's highest share.
Break the league's 48 division rivalry pairs out individually and the pattern sharpens: three of the six widest-margin rivalries are AFC East pairs — Buffalo–New England (14.10 average margin, third-widest), Jets–New England (14.02, fourth), and Miami–New England (13.46, sixth), behind only Cardinals–Rams (14.58) and Cowboys–Eagles (14.27). The common thread in all three is the landlord. Familiarity is supposed to compress division games — the division-games page covers that story league-wide — but a quarter-century of one dominant tenant per era has kept this round-robin from ever being close.
2025: The Handover Season, As Recorded
The file's 2025 ledgers read like a changing of the guard, not a race. New England finished 14-3 with a +170 point differential (490 scored, 320 allowed) and went 7-3 in one-score games; Buffalo went 12-5, +116; Miami 7-10, −77; the Jets 3-14, −203. Inside the division the gap was wider still: the twelve 2025 AFC East games produced a mean margin of 15.8 points with only four one-score finishes, and the intra-division point differentials split New England (+78) and Buffalo (+41) from Miami (+3) and the Jets (−122).
What that means for 2026 is the question this page declines to answer with a number of its own. The base rates say repeat — 78.3% here versus 42.9% league-wide — but the 2020 and 2025 transitions both show that when this division flips, it flips hard. For actual 2026 win projections, see the site's predictions page.
The 2026 Round-Robin on the Calendar
The 2026 rows are unplayed, but the calendar facts are set, and they are odd in three ways:
- All twelve division games are Sunday-afternoon kickoffs. Twelve Sundays, zero night games (7 PM ET or later) — the whole round-robin sits in the 1:00 and 4:25 windows.
- It's back-loaded. Only 4 of the 12 land in weeks 1–9. Nothing happens until New England at Buffalo in week 4 (October 4), and the season closes with a week-18 doubleheader on January 10: Jets at Buffalo, Miami at New England.
- All four clubs open on the road — the only division sending all four out in week 1: Buffalo at Houston, Miami at Las Vegas, the Jets at Tennessee, New England at Seattle in the Wednesday-night season opener. The week-1 slate page works all sixteen openers game by game.
The team-level calendar splits the division in two, twice over. Rest: Buffalo nets +14 days of rest edge across the season and New England +8, while Miami sits at −6 and the Jets at −9. Windows: Buffalo drew six night kickoffs and six non-Sunday dates (two Thursdays, two Mondays, a Friday, a Saturday), New England five night games including the Wednesday opener — Miami and the Jets drew zero night kickoffs and all-Sunday schedules. Byes run Miami week 6, Buffalo week 7, New England week 11, the Jets week 13. The league-wide rest ledgers and bye maps live at the schedule-quirks page; the schedule-strength page owns whose full slate is hardest on paper.
Honest Limitations
- Division wins are not titles. The grid counts each team's six intra-division games; champions are decided on the full season record. The amber outlines come from a standings derivation (win percentage, then the official tiebreaker chain) shared with the division-repeats page and verified against all 23 tiebreaker-decided titles in the window — but a team can top its grid row and still lose the division.
- Margin is not drama. The closeness ledger measures final scores; a division can produce wide margins and still stage a tight title race. 13.08 versus 10.32 is a statement about games, not races.
- History is not a forecast. The 78.3% repeat rate is a base rate over 23 transitions, five of which broke — including the two most recent handovers. This page states no 2026 win predictions; the model that does lives at the prediction-model explainer.
- The 2026 rows are unplayed and the schedule can move. Every 2026 fact above is a calendar fact from the file as pulled; kickoff times get flexed. Re-running the script regenerates everything.
Reproduce It
One public file: games.csv from nflverse nfldata, bundled at /data/games.csv. The chart and full console breakdown come from explainer_src/make_afc_east_2026_chart.py, which imports the standings/tiebreaker derivation from the division-repeats script. The core of the record and closeness claims is a screenful of pandas:
import pandas as pd

df = pd.read_csv("https://nflanalytic.com/data/games.csv")
df[["home_team", "away_team"]] = df[["home_team", "away_team"]].replace(
    {"SD": "LAC", "STL": "LA", "OAK": "LV"})
reg = df[(df.game_type == "REG") & df.home_score.notna()
         & df.season.between(2002, 2025)]

EAST = ["BUF", "MIA", "NE", "NYJ"]
de = reg[(reg.div_game == 1) & reg.home_team.isin(EAST)
         & reg.away_team.isin(EAST)]               # 288 games
for t in EAST:
    w = (((de.home_team == t) & (de.result > 0)) |
         ((de.away_team == t) & (de.result < 0))).sum()
    n = ((de.home_team == t) | (de.away_team == t)).sum()
    print(t, f"{w}-{n - w}")                       # NE 103-41 ... NYJ 51-93

m = de.result.abs()                                # closeness, AFC East
print(len(de), round(m.mean(), 2),                 # 288  13.08
      round(100 * (m <= 8).mean(), 1),             # one-score: 44.4%
      round(100 * (m >= 14).mean(), 1))            # 14+: 39.6%

s26 = df[(df.season == 2026) & (df.game_type == "REG") & (df.div_game == 1)
         & df.home_team.isin(EAST) & df.away_team.isin(EAST)]
print(len(s26), s26.weekday.value_counts().to_dict(),
      int((s26.week <= 9).sum()))                  # 12  {'Sunday': 12}  4
All figures on this page were computed 2026-08-12 from the file's played games — 6,223 regular-season games 2002–2025, including the 288 AFC East division games — plus the 2026 schedule rows for calendar facts only. Nothing is hand-entered; no 2026 result is quoted anywhere because none exists.
Data: nflverse/nfldata, public. Relocated franchises folded into current codes (SD→LAC, STL→LA, OAK→LV); one-score means a final margin of eight points or fewer.
Further Reading
- Do division champions repeat? — the league-wide 42.9% repeat rate and the tiebreaker chain this page's standings are built on.
- Division games are different — home-field and familiarity in the round-robin, league-wide.
- The 2026 week-1 slate — all sixteen openers, including the AFC East's four road trips.
- The team pages: Buffalo Bills, Miami Dolphins, New England Patriots, New York Jets.
- Around the conference: AFC North 2026, AFC South 2026, AFC West 2026.
Go deeper
Want the code behind these metrics? Work through the 43-chapter NFL analytics tutorial.
Browse tutorials Free tools