The Shape of the Week: 16 Games, Four Days
The 2026 season opens with 16 games across four days: one on Wednesday, September 9, one on Thursday, thirteen on Sunday the 13th, one on Monday the 14th. Sunday splits into eight kickoffs at 1:00 PM ET, four at 4:25, and a night game at 8:20; the week's earliest start is that 1:00 window, its latest the 8:35 PM Thursday game. Five of the 16 are division games — and none kicks off at 1:00: all five sit in standalone or late windows (Thursday, two 4:25s, Sunday night, Monday night). This page walks the slate game by game with each pairing's head-to-head ledger from the file; the rest of the preview machinery lives at the 2026 season hub, and the model's frozen week-1 numbers — a win probability for each of these 16 games, locked before kickoff and graded after — live on the prediction ledger.
The two oddities up front. Per the schedule file, the season's first row is New England at Seattle on Wednesday, September 9, 8:20 PM ET at Lumen Field — the schedule-quirks page already covers the calendar side: both clubs get 11 days before week 2, so the odd opener costs neither side anything later. The file doesn't say why it's a Wednesday; league announcements and schedule-release coverage (ESPN, Sky Sports) do: the opener is a rematch of February's Super Bowl, moved up a day to clear the broadcast window for Thursday's game in Melbourne, Australia: the NFL's first regular-season game there, San Francisco at the Rams at the Melbourne Cricket Ground — the row the file marks location = Neutral — kicking off Friday morning local time. As of this writing, reports call it the first Wednesday season start since 2012 and the first week-1 Super Bowl rematch since 2016.
The Exhibit: Every Pairing's Ledger Since 1999
For each of the 16 matchups, count every regular-season meeting in the file from 1999 through 2025, with relocated franchises folded into their current codes (San Diego→LAC, St. Louis→LA, Oakland→LV). The visitor's wins extend left, the host's right:
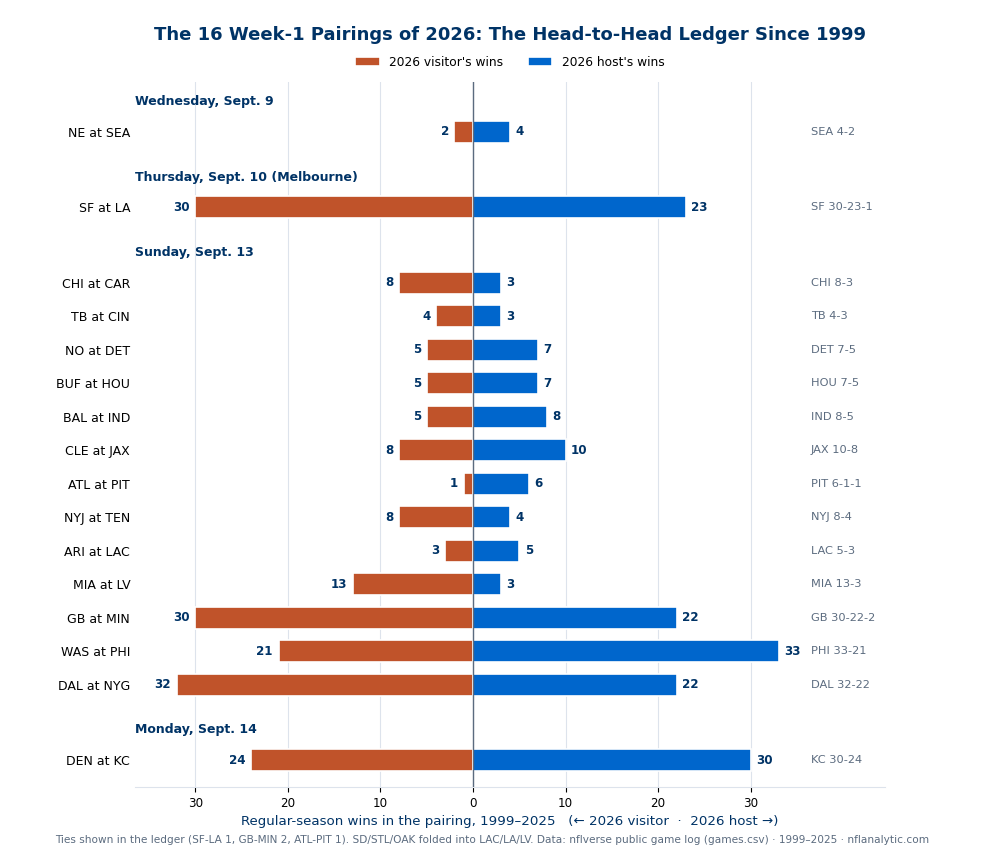
The 393 prior meetings are distributed feudally: the five division games account for 270 of them, and no other pairing has met more than 18 times. The slate in order, one file-fact per game:
Wednesday and Thursday: A Super Bowl Rematch, Then Melbourne
- New England at Seattle (Wed 8:20 PM ET). The rarest pairing on the slate: six regular-season meetings since 1999, Seattle up 4-2 (points 154-151) with four straight wins, 2012 through 2024 — and the pair's only playoff meetings are both Super Bowls: New England 28-24 in February 2015, Seattle 29-13 this past February 8. New England hasn't beaten Seattle since that 2015 title game, and the clubs have never met in week 1.
- San Francisco at L.A. Rams, Melbourne (Thu 8:35 PM ET). A 54-game division series moves to a cricket ground: San Francisco leads 30-23-1 (points 1,248-1,113), but the Rams took the most recent meeting 42-26 last November after a 2025 split. All 55 prior meetings in the file, the 2021 NFC title game included (Rams, 20-17), were played at one of their own stadiums — this is the pairing's first neutral-site game on record, and their first week-1 meeting since 2016 (San Francisco, 28-0).
Sunday, 1:00 Window: Eight Games, Zero Division Games
- Chicago at Carolina. Chicago leads 8-3 with a +5.7 average margin and four straight series wins — but is 2-3 in Charlotte. The Bears arrive carrying the hardest 2026 schedule on paper.
- Tampa Bay at Cincinnati. The stalest pairing of the week: seven meetings in the file, none since 2022, never in week 1. Tampa Bay won the first four, Cincinnati the last three; five of the seven were decided by three points or fewer.
- New Orleans at Detroit. Detroit leads 7-5 yet has been outscored 339-291 — the Saints' five wins came by 17.4 points on average, the Lions' seven by 5.6. Their third week-1 meeting (2000, 2009).
- Buffalo at Houston. Houston leads 7-5 and has won the last two, both at home, by a combined seven points — plus the 2019 wild-card game. Buffalo still owns the series scoring edge (+1.6 a game), mostly on one afternoon: 40-0 in 2021.
- Baltimore at Indianapolis. Indianapolis leads 8-5 and 288-248 on points, took the most recent meeting 22-19 in Baltimore in 2023, and won the only prior week-1 matchup 24-7 in 2005.
- Cleveland at Jacksonville. Jacksonville leads 10-8 with a 400-293 scoring bulge — and has lost three straight to Cleveland anyway. The headline here is the opener record book below.
- Atlanta at Pittsburgh. The least balanced ledger of the day: Pittsburgh 6-1-1 with five straight wins; Atlanta's lone victory was a 41-38 overtime game in 2006, alongside a 34-34 tie in 2002. The third time this pairing opens a season — Pittsburgh won both others (15-9 in 2010, 18-10 in 2024).
- N.Y. Jets at Tennessee. The Jets lead 8-4 with a +3.5 average margin and have won the last two, including 24-17 in Nashville in 2024.
Sunday Late Windows Through Monday Night: Division Month Starts Early
- Arizona at L.A. Chargers (4:25). Only eight meetings and the most lopsided per-game ledger of the week: the Chargers lead 5-3 with a +9.5 average margin — Arizona's three wins came by a combined six points, the Chargers' five by 82, including 41-10 and 45-10.
- Miami at Las Vegas (4:25). The most one-sided ledger by wins: Miami leads 13-3 with a +7.4 average margin, took nine of the first ten, and has won the last two. First week-1 meeting in the file.
- Green Bay at Minnesota (4:25). Border battle number 55: Green Bay leads 30-22-2 and has outscored Minnesota 1,364-1,163 (+3.7 a game). The 2025 split went to the home teams, 23-6 and 16-3; their fifth week-1 meeting since 1999, with the previous four split 2-2.
- Washington at Philadelphia (4:25). Philadelphia leads 33-21 (+4.1 a game) and owns the pairing's biggest recent result, 55-23 in the January 2025 NFC title game — but the road team won both 2025 meetings, Washington taking the finale 24-17 in Philadelphia. Their fifth week-1 meeting since 1999.
- Dallas at N.Y. Giants (Sun 8:20 PM). The league's favorite opener: the ninth week-1 meeting of this pairing since 1999, most of any 2026 matchup. Dallas won seven of the first eight (the exception: 20-19 in 2016), including 40-0 in 2023, and leads 32-22 overall — though the Giants took the most recent meeting 34-17 last January.
- Denver at Kansas City (Mon 8:15 PM). Meeting number 55, and the strangest ledger of the slate: Kansas City leads 30-24 while being outscored 1,201-1,166. Inside those 54 games sit a 16-game Chiefs win streak (2015-2023) and, right now, three straight Denver wins — 38-0, 22-19, 20-13 — the Broncos' first three-game run in the series since 2014-15.
The Opener Record Book, 1999–2025
The file holds 428 played week-1 games since 1999. Count each franchise's record in them (relocations folded in) and the range is enormous:
| Franchise | Week-1 record | Win% |
|---|---|---|
| New England | 18-9 | 66.7% |
| Philadelphia | 18-9 | 66.7% |
| Pittsburgh | 17-9-1 | 64.8% |
| Green Bay | 17-10 | 63.0% |
| San Francisco | 17-10 | 63.0% |
| … 22 franchises between … | ||
| Chicago | 11-16 | 40.7% |
| Las Vegas | 11-16 | 40.7% |
| Carolina | 10-17 | 37.0% |
| N.Y. Giants | 9-18 | 33.3% |
| Cleveland | 3-23-1 | 13.0% |
Cleveland's 3-23-1 stands alone: three opener wins in 27 years (2004, 2022, 2023, plus a 2018 tie), six wins behind the next-worst franchise. Philadelphia enters on five straight opener wins; the Giants — Sunday night's host — have lost 11 of their last 13, and the 1:00 window pairs two of the bottom five: Chicago (11-16) at Carolina (10-17). (Some franchises show 24-26 openers: Houston joined in 2002, and five openers slid to week 2.) Before reading anything into these records, the week-1 signal page owns what openers actually predict: opener winners made the playoffs 53.3% of the time versus 25.3% for losers — and game 1 predicts the rest of the season no better than any other single game.
The Early Lines in the File
The 2026 week-1 rows already carry market fields, quoted here as of the dataset's pull, not today's board. All 16 games have a spread and total. Home teams are favored in 11, visitors in five (Chicago, Buffalo, Baltimore, Green Bay, Dallas — none by more than 3.5). The widest spread is the Chargers, 11.5 over Arizona; three games sit at 1.5, with Buffalo-Houston's moneylines the closest to even (−112/−108). Seattle opens a 3.5-point favorite over New England; the Rams are 3 over San Francisco in Melbourne. Totals run from 39.5 (Jets-Titans) to 50.5 (Buccaneers-Bengals), averaging 45.2. Lines move daily; treat these as the file's snapshot, nothing more.
Honest Limitations
- Ledgers are franchise history, not roster comparisons. A 54-game series spans a quarter-century of quarterbacks, coaches, and front offices — Green Bay's 30-22-2 over Minnesota says nothing about 2026 depth charts, and this page makes no roster claims.
- Week 1 is one game of evidence. Winning it roughly doubles a team's historical playoff rate (53.3% vs 25.3%) yet predicts the rest of the season no better than any other single game — the signal page holds the full accounting.
- Conventions. Head-to-head counts are regular-season games, 1999–2025, with SD/STL/OAK folded into LAC/LA/LV; playoff meetings are cited separately, never mixed into the ledgers.
- The file's fields are reported as recorded. Roof tallies follow the
roofcolumn, which codes the Melbourne row as a dome and leaves Houston's and Indianapolis' retractables blank until game day; all week-1 rest fields read 7 by convention. The why-Wednesday and Melbourne context is from league announcements and press coverage, accurate as of this writing; every number comes from the file. - The schedule can move. This reads the slate as published in the data file today; if games move, rerunning the script regenerates every number here.
Reproduce It
One public file: games.csv from nflverse nfldata, bundled at /data/games.csv. The slate is the 16 season == 2026, week == 1 rows; every ledger is a filter over the played games. The chart and the full console breakdown — per-day structure, all 16 head-to-heads, the opener record book, and the line fields — come from explainer_src/make_week1_slate_chart.py; the core is a screenful of pandas:
import pandas as pd, numpy as np

df = pd.read_csv("https://nflanalytic.com/data/games.csv")
df[["home_team", "away_team"]] = df[["home_team", "away_team"]].replace(
    {"SD": "LAC", "STL": "LA", "OAK": "LV"})
wk1 = df[(df.season == 2026) & (df.game_type == "REG") & (df.week == 1)]
print(len(wk1), wk1.weekday.value_counts().to_dict(), int(wk1.div_game.sum()))
# 16  {'Sunday': 13, 'Wednesday': 1, 'Thursday': 1, 'Monday': 1}  5

reg = df[df.home_score.notna() & (df.game_type == "REG")]      # 6,967 played games
for _, g in wk1.iterrows():
    a, h = g.away_team, g.home_team
    m = reg[((reg.home_team == a) & (reg.away_team == h)) |
            ((reg.home_team == h) & (reg.away_team == a))]
    ap = np.where(m.home_team == a, m.home_score, m.away_score)
    hp = np.where(m.home_team == h, m.home_score, m.away_score)
    print(a, "at", h, f"{(ap > hp).sum()}-{(hp > ap).sum()}-{(ap == hp).sum()}",
          int(ap.sum()), int(hp.sum()))                        # e.g. SF at LA 30-23-1 1248 1113

w1 = reg[reg.week == 1]                                        # 428 openers
for t in sorted(set(wk1.home_team) | set(wk1.away_team)):
    g = w1[(w1.home_team == t) | (w1.away_team == t)]
    w = (((g.home_team == t) & (g.result > 0)) |
         ((g.away_team == t) & (g.result < 0))).sum()
    tie = (g.result == 0).sum()
    print(t, f"{w}-{len(g) - w - tie}-{tie}")                  # CLE 3-23-1 ... NE 18-9-0
All figures on this page were computed 2026-08-12: the slate from the file's 16 week-1 rows, the ledgers and opener records from its 6,967 played regular-season games (1999–2025). Nothing here is hand-entered.
Data: nflverse/nfldata, public. Head-to-head ledgers count regular-season games only; the Super Bowl-rematch and Melbourne context is per league announcements and schedule-release reporting (ESPN, Sky Sports, NFL.com, the MCG), as of this writing.
Further Reading
- Does week 1 mean anything? — what 861 openers actually predicted: a real playoff-rate gap, no special signal.
- Reading the 2026 schedule — the Wednesday opener's calendar mechanics, the rest ledger, and the bye map.
- The 2026 strength of schedule — whose slate is hardest on paper, and how much preseason SOS lies.
- The division-by-division 2026 previews: AFC East, AFC North, AFC South, AFC West, NFC East, NFC North, NFC South, NFC West.
- Division games are different — context for the five divisional matchups the week saves for prime windows.
Go deeper
Want the code behind these metrics? Work through the 43-chapter NFL analytics tutorial.
Browse tutorials Free tools