The Division That Keeps Winning Ugly
Every division sends a champion to the playoffs. The NFC South has spent the last decade testing how little that word has to mean. Since the 2002 realignment created the current eight four-team divisions — 24 seasons, 192 division titles, 6,223 regular-season games in the file — the league has crowned exactly five champions with a strictly losing record. Three of the five are NFC South champions: Carolina at 7-8-1 in 2014, Tampa Bay at 8-9 in 2022, and Carolina again at 8-9 in 2025, the reigning titleholder. No other division has done it more than once. This page reads the division's full championship ledger out of the game file and then lays out the shape of its 2026 schedule — facts only; the site's win forecasts live at the predictions page and its machinery at the model explainer.
The Exhibit: 24 Champions, Normalized
Panel A plots the NFC South champion's wins in every season since 2002, normalized per 16 games (win percentage × 16, ties counting half) so the 17-game seasons from 2021 on sit on the same scale. Panel B ranks the worst regular-season point differentials posted by any division champion in the window — all 32 teams, all 24 seasons:
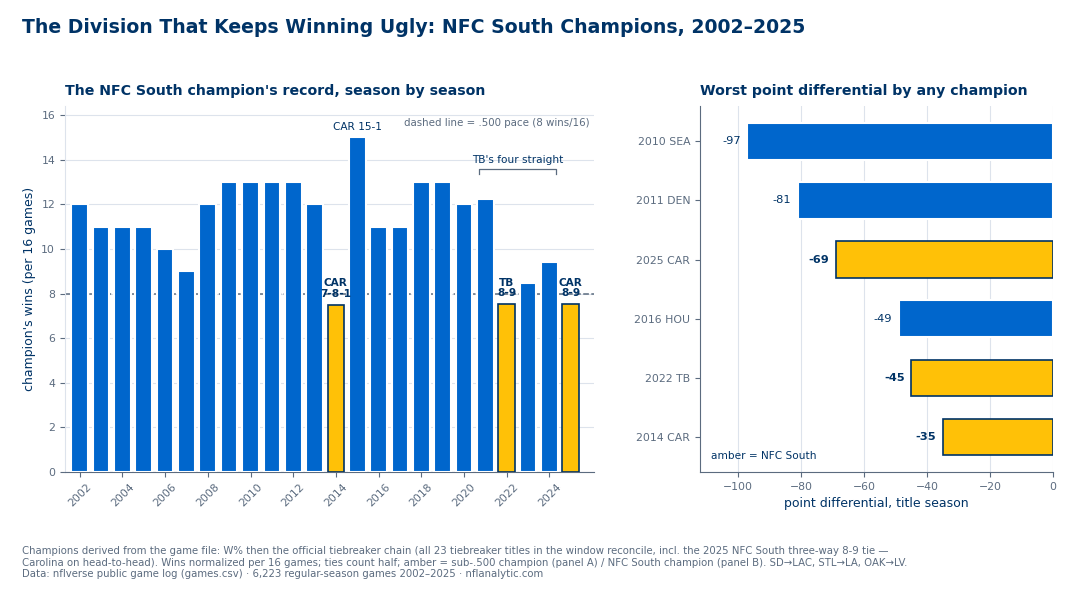
The chart splits into two eras at 2014. From 2002 through 2013 the champion's floor was Tampa Bay's 9-7 in 2007, and 13-3 was the modal great season — the champion finished 13-3 six times between 2009 and 2019 (New Orleans four of them, Atlanta in 2010 and 2012). Since 2014 the division has produced both its best season (Carolina's 15-1 in 2015) and all three of its losing champions. The last four title records read 8-9, 9-8, 10-7, 8-9 — no champion has cleared 10 wins since Tampa Bay's 13-4 in 2021.
Winning Ugly, Quantified
Panel B is the sharper indictment. Rank all 192 champion seasons by point differential and the bottom six are: 2010 Seattle at −97 (the case study of the NFC West preview), 2011 Denver at −81, 2025 Carolina at −69, 2016 Houston at −49 (see the AFC South preview), 2022 Tampa Bay at −45, and 2014 Carolina at −35. One division holding three of the six worst-outscored champions in a quarter-century is the statistical signature of a repeated event, not a fluke season — and the other two sub-.500 champions in the window, 2010 Seattle (7-9) and 2020 Washington (7-9, covered in the NFC East preview), each happened exactly once to their divisions.
The flip side deserves equal weight, because "the NFC South is always bad" is not what the file says. All four clubs have won the division — New Orleans and Tampa Bay seven titles each, Carolina six, Atlanta four — and from 2017 through 2024 it produced consecutive four-peats: New Orleans took four straight (three of them at 13-3), then Tampa Bay took the next four. Whether streaks like that are typical is the division-repeats page's question, not this one; league-wide, the champion repeating is closer to a coin flip than a dynasty guarantee.
How 2025 Was Actually Decided
The reigning title is itself a tiebreaker artifact, which is why the derivation matters. This page does not scrape a standings table: champions are computed from the game file using the same code path as the division-repeats analysis — win percentage first, then the NFL's official tiebreaker chain with the multi-club restart rule. That chain reproduces all 23 tiebreaker-decided titles among the 192 in the window, including 2025's: Carolina, Tampa Bay, and Atlanta all finished 8-9, and Carolina won the division on head-to-head record among the tied clubs — 3-1, against Tampa Bay's 2-2 and Atlanta's 1-3. A three-way tie at 8-9, settled two steps into the chain, producing a champion outscored by 69 points: the 2025 NFC South in one sentence.
The 2026 Shape of the Race
The 2026 rows in the file are schedule, not results, and this page treats them that way. What the calendar says:
- All four open in the same window. Sunday, September 13, 1:00 PM ET: Chicago at Carolina, Tampa Bay at Cincinnati, New Orleans at Detroit, Atlanta at Pittsburgh. Three of the four open on the road; none opens with a division game. Each pairing's head-to-head ledger is on the week-1 slate page.
- Twelve division games, spread late. The first is Carolina at Atlanta in week 2 (September 20); two land on Monday night (Atlanta at New Orleans, October 5; Carolina at Tampa Bay, November 30). New Orleans gets the heaviest finish: division games in four of its last five weeks (14, 15, 17, 18).
- Week 18 is winner-take-all-shaped. January 10, 2027 closes with both pairings in-division: Atlanta at Carolina and Tampa Bay at New Orleans. If 2026 resembles the last four years, that Sunday decides the title — but that is a conditional, not a forecast.
For who is favored, this site keeps one opinion in one place: nfl-predictions.html. Schedule difficulty is on the SOS page, and rest edges and bye placement on the schedule-quirks page.
Honest Limitations
- Division history is not a roster argument. Three sub-.500 titles in twelve seasons describe the division's past output, not its 2026 talent. Nothing here predicts a win total, and the streak of ugly champions is exactly the kind of pattern that can end without warning.
- Normalization is a choice. Wins per 16 (with ties as half) makes 16- and 17-game champions comparable but slightly flatters 17-game records — 2022 Tampa Bay's 8-9 plots at 7.53, above 2014 Carolina's 7.50, though one is a half-game "better" mostly by arithmetic.
- Point differential is a blunt lens. It treats a −40 garbage-time loss like four one-score losses. It is used here only to rank champions against champions, all measured the same way.
- Small denominators. Five sub-.500 champions in 192 titles is a 2.6% base rate; three-of-five concentration in one division is striking but still a count of three events.
- Conventions. Window 2002–2025; regular season only; SD→LAC, STL→LA, OAK→LV folded in (immaterial to this division). The 272 scoreless 2026 rows drop out of every computation.
Reproduce It
One public file: games.csv from nflverse nfldata, bundled at /data/games.csv. The chart and every number above come from explainer_src/make_nfc_south_preview_chart.py, which imports the standings-and-tiebreakers code from the division-repeats script. The core, minus the tiebreaker chain, is a screenful of pandas:
import pandas as pd

df = pd.read_csv("https://nflanalytic.com/data/games.csv")
reg = df[(df.game_type == "REG") & df.home_score.notna()
         & df.season.between(2002, 2025)]          # 6,223 games

SOUTH = ["ATL", "CAR", "NO", "TB"]
for season in range(2002, 2026):
    for t in SOUTH:
        g = reg[(reg.season == season) &
                ((reg.home_team == t) | (reg.away_team == t))]
        pf = g.apply(lambda r: r.home_score if r.home_team == t
                     else r.away_score, axis=1).sum()
        pa = g.apply(lambda r: r.away_score if r.home_team == t
                     else r.home_score, axis=1).sum()
        w = ((g.home_team == t) & (g.result > 0)).sum() \
          + ((g.away_team == t) & (g.result < 0)).sum()
        ties = (g.result == 0).sum()
        losses = len(g) - w - ties
        wpct = (w + 0.5 * ties) / len(g)
        print(season, t, f"{w}-{losses}-{ties}",
              f"wins/16={wpct * 16:.2f}", f"diff={int(pf - pa):+d}")
# 2025: ATL 8-9-0, CAR 8-9-0, TB 8-9-0 -> tiebreakers decide.
# Champion selection = W% then the official chain (head-to-head,
# division record, common games, ...) with the multi-club restart
# rule; see make_division_repeat_chart.py for the implementation
# that reconciles all 23 tiebreaker titles in the window.
All figures on this page were computed 2026-08-12 from the file's played games — 6,223 regular-season rows, 2002–2025; the 2026 schedule facts are read from its unplayed 2026 rows. Nothing here is hand-entered.
Data: nflverse/nfldata, public. Champions and tiebreakers derived from game results, not scraped standings.
Further Reading
- Do division champions repeat? — the league-wide repeat rate and the tiebreaker chain this page's standings are built on.
- The 2026 week-1 slate — head-to-head ledgers for all four NFC South openers.
- Neighboring previews with their own ugly-champion chapters: NFC West (2010 Seattle, −97), NFC East (2020 Washington), AFC South (2016 Houston, −49).
- Division games are different — why the twelve intra-South games, five of them in weeks 14–18, carry extra familiarity effects.
- The clubs: Atlanta, Carolina, New Orleans, Tampa Bay.
Go deeper
Want the code behind these metrics? Work through the 43-chapter NFL analytics tutorial.
Browse tutorials Free tools