The Reputation on Trial
The AFC North's brand is settled folklore: the blood-feud division, every game a coin flip in the mud. The game log can test that. Since the 2002 realignment, each of the eight divisions has played exactly 288 intra-division games — 48 per rivalry pair, 2,304 in all — and scoring every one by final margin splits the folklore in two. The AFC North ranks fourth of eight in one-score share; Baltimore–Pittsburgh ranks first of all 48 pairs, by average margin and one-score rate. The reputation is real — and carried almost entirely by one rivalry.
The Exhibit: Division Verdict, Pair Truth
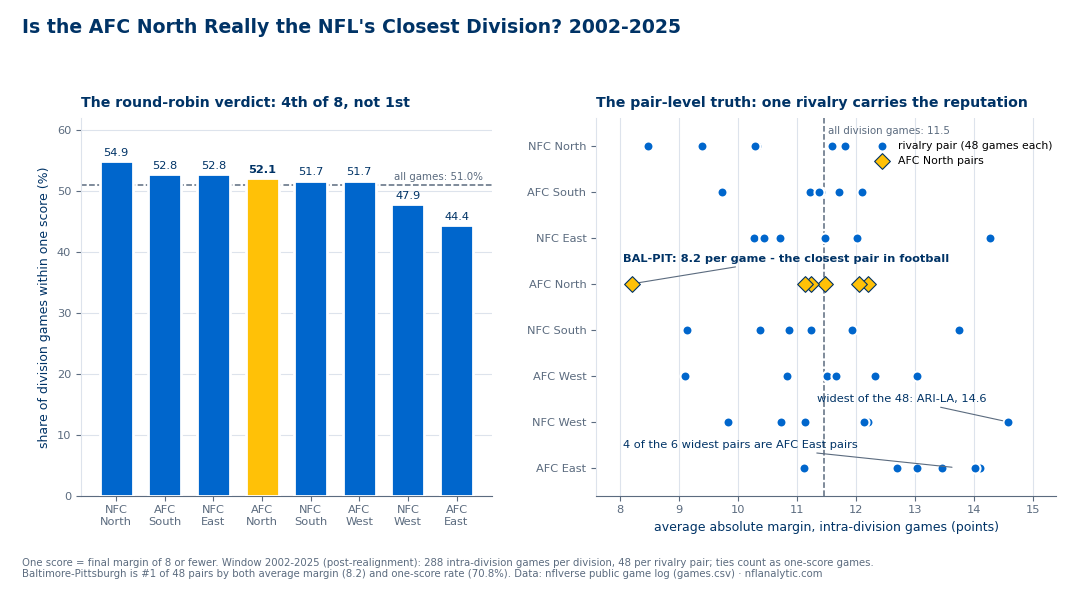
Both panels draw on the same 2,304 games: the left answers the division question, the right explains why it was the wrong question.
The Round-Robin Verdict: Fourth of Eight
The full table, 2002–2025: the NFC North leads at 54.9% one-score with a 10.3-point average margin (also the league's best), the AFC South and NFC East tie at 52.8%, and the AFC North sits fourth at 52.08%, average margin 11.06, median 8 — the median AFC North division game lands exactly on the one-score boundary. The NFC West (47.9%) and the AFC East (44.4%, average margin 13.1) fill out the bottom. For scale, the baseline across all 6,223 games is 51.0% one-score — the AFC North runs about a point closer than football at large: a real edge, not a mythology-sized one. (Division games as a class barely beat that baseline — 51.04% — the familiarity question belongs to the division-games page.)
One footnote runs the folklore's way: the AFC North's one-score share climbed from 47.9% in 2002–2009 to 53.1% in 2010–2017 to 55.2% in 2018–2025 — the recent-memory division really has been closer than the full-window one. Overtime is no outlier, though: 18 of 288 games (6.2%).
One Pair Carries It: Baltimore–Pittsburgh, #1 of 48
Rank all 48 rivalry pairs by average absolute margin and the list opens: BAL–PIT 8.21, DET–MIN 8.48, KC–LAC 9.10, ATL–NO 9.15, CHI–DET 9.40. Re-rank by one-score rate and Baltimore–Pittsburgh is first again at 70.8% — the only pair to top both tables. The 48-game file: 34 meetings within one score, 24 within a field goal, 7 overtimes, a 3.5-point median margin, only two games decided by 28-plus, and 13 seasons in which both annual meetings finished one-score. The league's other extreme, Arizona–Rams, sits at 14.58 — nearly 6.4 points per game wider.
The division's other five pairs expose the trick: Cincinnati–Pittsburgh averages 11.15 (54.2% one-score), Baltimore–Cleveland 11.25 (47.9%), Baltimore–Cincinnati 11.48 (54.2%), Cleveland–Pittsburgh 12.06 (43.8%), and Cincinnati–Cleveland 12.21 at just 41.7% — the Battle of Ohio has been less close than the average NFL game. Five pairs sit at or near the league norm; one sits three points per game clear of everything else in football. The closeness reputation is, to a first approximation, the Ravens–Steelers series wearing a division's name.
Titles: A Three-Team Race With a 24-Year Asterisk
Deriving champions from the game log — via the standings code imported from the division-repeats page's generator, verified against all 23 official tiebreaker-decided titles in the window — gives the ledger since 2002: Pittsburgh 10, Baltimore 8, Cincinnati 6, Cleveland 0. Cleveland is the only NFL franchise without a division title since realignment, and has held or shared last place in 17 of 24 seasons (Cincinnati 6, Baltimore 3, Pittsburgh 0). Yet among the three that do win it, the crown circulates fast: the division's longest title run is just 2 — no three-peat ever, the shortest maximum run of any division — and its 6 repeats in 23 transitions trail everyone except the NFC East's 3, with the AFC East's 18 at the far extreme.
2025: A Title Decided by Two Points in Week 18
The 2025 file shows how thin the margins were. Pittsburgh won the division at 10-7 on a scoring margin of just +10 (397–387), built on a 7-3 record in one-score games; Baltimore finished 8-9 while outscoring opponents by 26 (424–398), dragged under .500 by going 2-5 in one-score games. Cincinnati (6-11, −78) and Cleveland (5-12, −100) were never in it. The 12 internal games produced 7 one-score finishes, and the last settled everything: both contenders entered week 18 at 3-2 in the division, and Pittsburgh won the finale 26–24. A Baltimore win would have left both 9-8 with a split head-to-head, sending the title to division record — tiebreaker step 2 — where Baltimore's 4-2 beats Pittsburgh's 3-3. Two points flipped the champion.
The 2026 Shape: Five of Twelve Division Games in Weeks 15–18
The 2026 rows are schedule facts only — no results, and no predictions here (the site's forecasts live at the predictions page and the model explainer). All four open outside the division — Baltimore at Indianapolis, Tampa Bay at Cincinnati, Cleveland at Jacksonville, Atlanta at Pittsburgh, covered in the week-1 slate preview — and the round-robin starts in week 3, Cincinnati at Pittsburgh. Of the 12 division games, 10 are Sundays and 2 are Thursday nights (Pittsburgh at Cleveland in week 4; Baltimore at Cincinnati on Thursday, December 31, a New Year's Eve division game), 3 at night in all. The back-loading is the story: 5 of the 12 land in weeks 15–18, including Baltimore at Pittsburgh in week 15 and a week-18 finale of Pittsburgh at Baltimore and Cleveland at Cincinnati — the same two fixtures that closed 2025.
The calendar is not symmetric. Two division games carry a 14-vs-7 rest gap: Cincinnati visits Baltimore in week 7 off its bye, Pittsburgh visits Cincinnati in week 10 off its own. Season-long, Pittsburgh runs the division's worst net rest at −6 days (Cincinnati −4, Baltimore −3, Cleveland even), and three of the four play internationally — Baltimore–Dallas at the Maracanã (week 3), Pittsburgh–New Orleans at the Stade de France (week 7), Cincinnati–Atlanta at the Bernabéu (week 9) — while Cleveland stays home all year. League-wide calendar mechanics: the schedule-quirks page.
Honest Limitations
- Closeness is not quality. A 52% one-score rate says the games were tight, not that the teams were good; the division's 2025 bottom half went 11-23.
- 288-game samples still wobble. The gap between 4th (52.08%) and 2nd (52.78%) is two games' worth of outcomes; the era splits (96 games each) are noisier still.
- The window is a choice. 2002–2025, because realignment makes the eight divisions structurally identical — 48 games per pair, like-for-like.
- History is not a roster claim. The 8.2-point BAL–PIT average spans a quarter-century of rosters; nothing here predicts a 2026 result, and the unplayed 2026 rows contribute schedule fields only.
- Conventions. One-score = 8 points or fewer, ties count as one-score, relocated franchises folded into current codes (SD→LAC, STL→LA, OAK→LV).
Reproduce It
One public file: games.csv from nflverse nfldata, bundled at /data/games.csv. The exhibit and full console breakdown come from explainer_src/make_afc_north_2026_chart.py; the core fits in a screenful:
import pandas as pd

df = pd.read_csv("https://nflanalytic.com/data/games.csv")
df[["home_team", "away_team"]] = df[["home_team", "away_team"]].replace(
    {"SD": "LAC", "STL": "LA", "OAK": "LV"})
gp = df[(df.game_type == "REG") & df.home_score.notna()
        & df.season.between(2002, 2025)]                  # 6,223 played games
dd = gp[gp.div_game == 1].copy()                          # 2,304 intra-division
dd["absm"] = dd.result.abs()

north = dd[dd.home_team.isin({"BAL", "CIN", "CLE", "PIT"})]
print(len(north), north.absm.mean().round(2),
      (100 * (north.absm <= 8).mean()).round(2))
# 288  11.06  52.08   -> 4th of 8 divisions by one-score share

dd["pair"] = ["-".join(sorted(p)) for p in zip(dd.home_team, dd.away_team)]
pairs = dd.groupby("pair").absm.agg(
    n="size", mean="mean",
    onescore=lambda x: 100 * (x <= 8).mean(),
    within3=lambda x: 100 * (x <= 3).mean())
print(pairs.sort_values("mean").head(3).round(2))
#          n   mean  onescore  within3
# BAL-PIT  48  8.21     70.83    50.00   <- #1 of 48 on both counts
# DET-MIN  48  8.48     ...
# KC-LAC   48  9.10     ...
All figures on this page were computed 2026-08-12 from the file's played games: the closeness tables from the 2,304 intra-division games of 2002–2025, the title and last-place ledgers from the derived standings, the 2026 section from the schedule fields of the unplayed rows. Nothing is hand-entered.
Data: nflverse/nfldata, public. Rerunning the script regenerates every number above.
Further Reading
- Do division winners repeat? — league-wide repeat rates and the official tiebreaker chain this page's standings derivation imports.
- The 2026 week-1 slate — all four AFC North openers, with head-to-head files.
- Neighboring previews: the NFC North (the division that actually leads the closeness table), the AFC East (last in it), and the AFC South.
- The 2026 strength of schedule — where the four AFC North slates rank on paper.
Go deeper
Want the code behind these metrics? Work through the 43-chapter NFL analytics tutorial.
Browse tutorials Free tools