Twenty-Four Crowns, Twelve Changes of Hands
The AFC South has existed for exactly 24 seasons, and its crown has changed hands in 12 of the 23 season-to-season transitions — roughly every other year. Derive every champion from the game file (win percentage, then the official NFL tiebreaker chain — the same code path used in the division-repeats study, which reproduces all 23 tiebreaker-decided titles in the window) and the sequence reads: Tennessee in 2002, then Indianapolis five straight from 2003 to 2007, and after that — nothing longer than two. In the eighteen seasons since 2008, no franchise has held the division more than two years running. Houston went back-to-back in 2023–24 and was dethroned; Jacksonville enters 2026 as the defending champion, carrying its third title in nine seasons and the question of whether it can do what nobody has done here in nearly two decades.
That churn sits mid-pack, not at the extreme: the NFC East changed champions 20 times in the same 23 transitions and the AFC East just 5 (one team, one 11-year run, did most of that). The AFC South's 12 changes place it among the quieter divisions on paper — but its title distribution is unusually flat: Indianapolis 9, Houston 8, Tennessee 4, Jacksonville 3, with the winningest club, Indianapolis, holding zero titles since 2014.
The Exhibit: The Title Grid and the 2025 Ledger
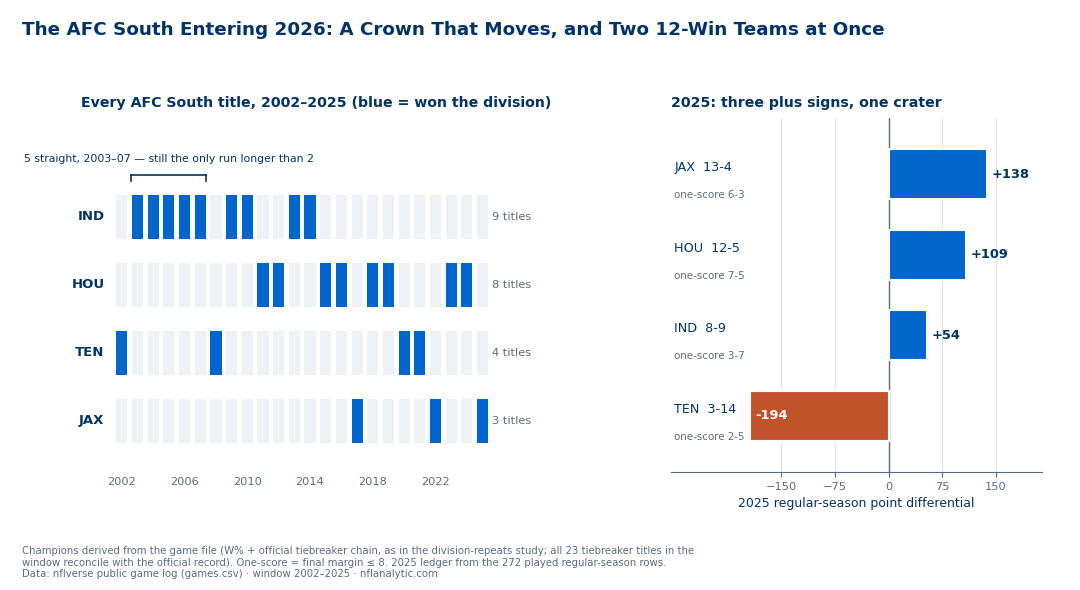
Two panels, both computed from the file: every title from 2002 through 2025 as a season-by-franchise grid, and the 2025 regular-season point differential the four teams carry into 2026, with records and one-score records attached.
What the Grid Says: One Dynasty, Then Musical Chairs
The full sequence: TEN, then IND×5, TEN, IND×2, HOU×2, IND×2, HOU×2, JAX, HOU×2, TEN×2, JAX, HOU×2, JAX. Read it as two eras. Through 2014 the division belonged to Indianapolis — nine titles in thirteen seasons, including the 2003–07 run that remains the only streak here longer than two. Since 2017 the crown has rotated among the other three: Jacksonville (2017, 2022, 2025), Houston (2018–19, 2023–24), Tennessee (2020–21), while Indianapolis — still the all-time leader with 9 — has now gone eleven seasons without one.
Whether any of this makes a 2026 repeat more or less likely is a league-wide question, and it is answered on the division-repeats page, which owns the base rates and the full tiebreaker mechanics; this page borrows its champion-derivation code and adds only the AFC South's particulars. Note that 2025 required none of that machinery in this division: Jacksonville's 13-4 cleared Houston's 12-5 outright.
The 2025 Ledger: Two Heavyweights, a +54 Loser, and a Crater
The right panel is the strangest part of the picture. In 2025 the AFC South produced, simultaneously:
- Jacksonville: 13-4, 474 scored, 336 allowed, +138. A 6-3 record in one-score games and a 5-1 mark inside the division — the lone divisional loss was 36-29 at Houston in week 10. The Jaguars closed 41-7 over Tennessee in week 18.
- Houston: 12-5, 404–295, +109. A 4-2 division record and a grinding 7-5 in one-score games — twelve of Houston's seventeen games were decided by 8 or fewer. The pair of 12-win clubs made 2025 the fourth season the AFC South housed two 12-win teams at once (2003, 2005, 2008) and the first since 2008.
- Indianapolis: 8-9 with a +54 differential. The Colts scored 466 points — eight fewer than the division champion — and still finished under .500, because they went 3-7 in one-score games. They swept Tennessee by a combined 79-34 and won at Houston 38-30 in week 18, yet went 1-3 against the division's top two, dropping both Jacksonville games and a 20-16 home decision to Houston. A positive-differential losing season is exactly the profile that point-based ratings and win-loss records disagree about; how the site's model weighs that tension is a matter for the forecast page, not this one.
- Tennessee: 3-14, 284 scored, 478 allowed, −194 — the second-worst differential in the 2025 league (only the Jets' −203 was worse), a 2-5 one-score record, and an 0-6 sweep inside the division.
So the division enters 2026 spanning nearly the full width of the league: 332 points of differential separate its best team from its worst, and the team in the middle is the one whose record and scoring profile point in opposite directions.
The 2026 Slate: Four Home Openers, Then a Long Fuse
The schedule facts below are read from the file's 2026 rows — opponents, dates, venues only; those games are unplayed and this page predicts nothing about them.
- All four open at home on Sunday, September 13: Buffalo at Houston, Baltimore at Indianapolis, Cleveland at Jacksonville, and the Jets at Tennessee. Each pairing's head-to-head history is covered game by game on the week-1 slate page.
- The first division game waits until week 3: Houston at Indianapolis, September 27. From there the twelve divisional matchups spread across weeks 3–18, with doubleheader weeks in week 6 (Houston at Jacksonville, Tennessee at Indianapolis), week 15 (Jacksonville at Houston, Indianapolis at Tennessee), and week 18, where the season closes with Tennessee at Houston and Jacksonville at Indianapolis on January 10.
- One weeknight division game: Indianapolis at Houston on Thursday, November 19 — a rematch of the week-18 game Indianapolis won 38-30 in January.
- The cross-schedule draw: full round-robins against the AFC North and NFC East, so the four clubs share those eight cross-division opponents; how that nets out on paper is the business of the schedule-strength page.
Honest Limitations
- Derived champions, not archival ones. Titles here are computed from game results via the tiebreaker chain, not scraped from a standings source. The derivation reconciles with the official record across the window (including all 23 tiebreaker-decided titles league-wide), but it is a reconstruction, and any future data correction to games.csv would flow through it.
- Point differential is descriptive, not destiny. Indianapolis's +54 at 8-9 is a fact about 2025, not a forecast; one-score records in particular are historically unstable year to year. This page makes no claim about which way any of these numbers regress.
- 2026 rows are schedule only. The 272 scoreless 2026 rows contain opponents, dates, and venues — nothing else. No 2026 result, standing, or probability appears on this page; the site's forecasts live at nfl-predictions.html.
- Conventions. One-score = final margin ≤ 8, the site-wide convention. The 2025 ledger uses regular-season rows only. The window starts at 2002 because the AFC South did not exist before realignment.
Reproduce It
One public file: games.csv from nflverse nfldata, bundled at /data/games.csv. The chart and the full console breakdown — the champion sequence, per-division change counts, and the 2025 ledger — come from explainer_src/make_afc_south_2026_chart.py, which imports the same tiebreaker logic as the division-repeats exhibit. The 2025 ledger itself is a screenful of pandas:
import pandas as pd, numpy as np

df = pd.read_csv("https://nflanalytic.com/data/games.csv")
reg = df[(df.game_type == "REG") & df.home_score.notna()]

g = reg[reg.season == 2025]                       # 272 played games
for t in ["JAX", "HOU", "IND", "TEN"]:
    m = g[(g.home_team == t) | (g.away_team == t)]
    my = np.where(m.home_team == t, m.home_score, m.away_score)
    op = np.where(m.home_team == t, m.away_score, m.home_score)
    close = np.abs(my - op) <= 8
    print(t, f"{(my > op).sum()}-{(my < op).sum()}",
          f"{int(my.sum() - op.sum()):+d}",
          f"one-score {(close & (my > op)).sum()}-{(close & (my < op)).sum()}")
# JAX 13-4 +138 one-score 6-3 ... IND 8-9 +54 one-score 3-7

# the 12 unplayed 2026 division games (schedule facts only)
AS = {"HOU", "IND", "JAX", "TEN"}
s26 = df[(df.season == 2026) & (df.game_type == "REG")]
dv = s26[s26.home_team.isin(AS) & s26.away_team.isin(AS)]
print(dv[["week", "gameday", "away_team", "home_team"]].to_string())
# first: week 3, HOU at IND ... last two: week 18, Jan 10
All figures on this page were computed 2026-08-12 from the file's played games: the title grid from the 2002–2025 regular seasons, the ledger from the 272 played 2025 regular-season rows, the 2026 items from the schedule fields of that season's unplayed rows. Nothing here is hand-entered.
Data: nflverse/nfldata, public. Champions derived via win percentage plus the official division tiebreaker chain (head-to-head, division record, common games, conference record, strength of victory, strength of schedule, with the multi-club restart rule).
Further Reading
- Do division champions repeat? — the league-wide repeat rates and the full tiebreaker machinery this page's champion grid is built on.
- The 2026 week-1 slate — the head-to-head ledgers behind all four AFC South home openers.
- Division games are different — why the twelve intra-division dates above carry their own home-field pattern.
- Around the conference: the AFC East (the 11-year-run division), AFC North (17 changes in 23), and AFC West 2026 previews.
- Houston · Indianapolis · Jacksonville · Tennessee — the four team pages.
Go deeper
Want the code behind these metrics? Work through the 43-chapter NFL analytics tutorial.
Browse tutorials Free tools