Six of Seventeen, and They Are Not Interchangeable
Five of the sixteen games on this season's opening board are division games, and the broadcast will tell you that each one is worth two in the standings. That is a slogan, and slogans are testable. So I tested it against every team-season since the 2002 realignment — 768 of them, each with exactly six division games and eleven or ten others — and asked one question: with a team's total win count held fixed, does it matter which column the wins came out of?
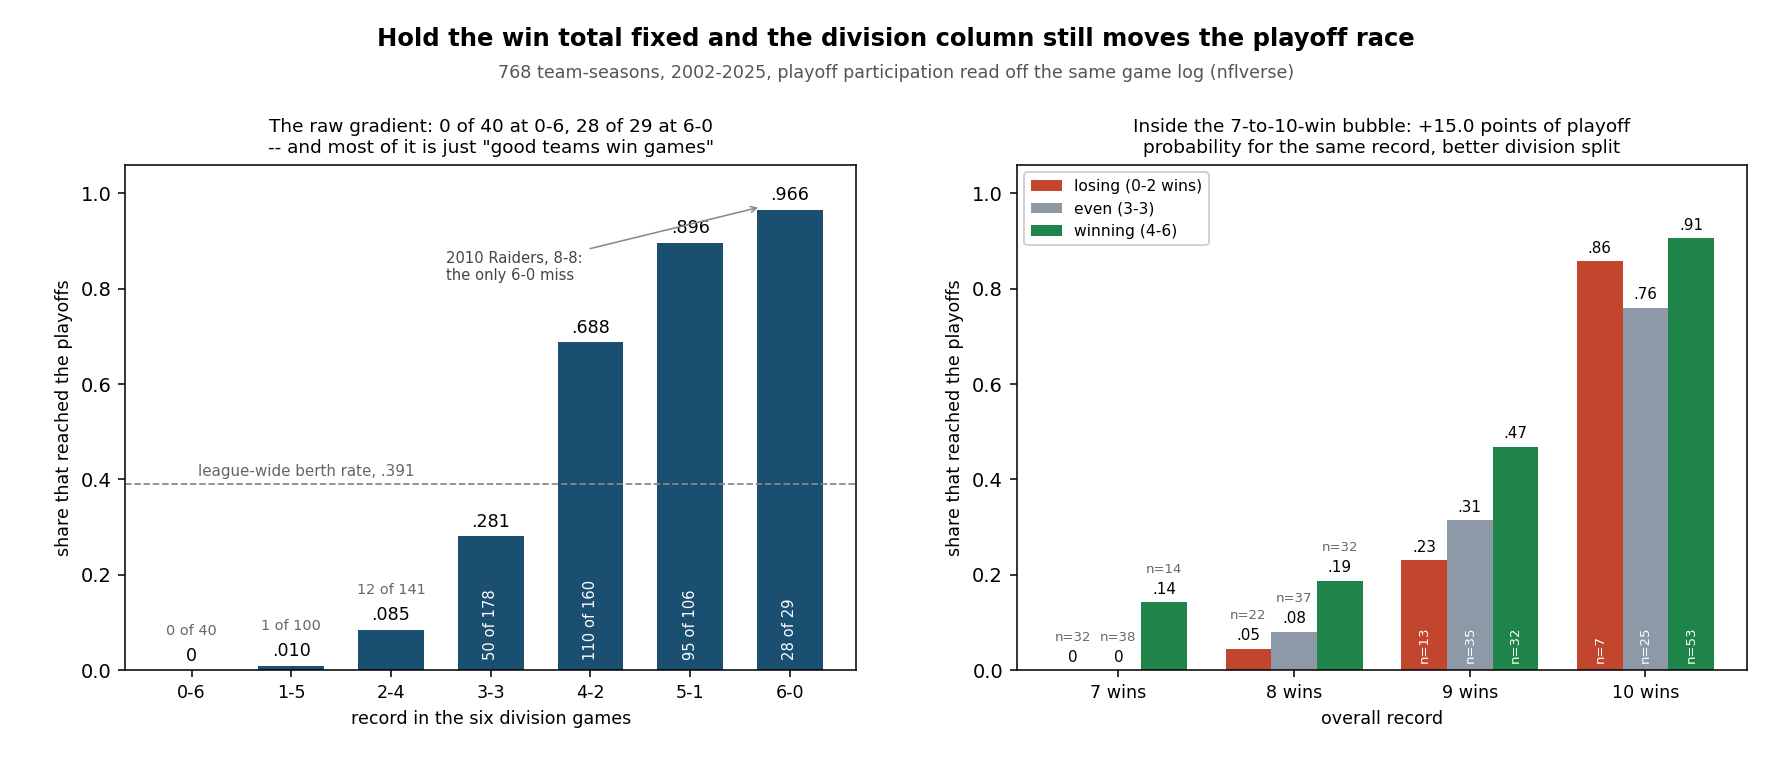
It does. Inside the seven-to-ten-win bubble where playoff berths are actually decided, a team with a winning division record reached the postseason 15.0 percentage points more often than a team with the same overall record and a losing one. Fit the two columns separately and a division win carries about 1.30 times the weight of a non-division win in the log-odds of a berth, a gap of 0.574 with a standard error of 0.168. The slogan overstates it — a division game is not worth two — but the slogan is pointing at something real.
The Raw Gradient, and Why Most of It Is Arithmetic
Start with the number that gets quoted. Sort all 768 team-seasons by their record in the six division games and count how many reached January:
| Record in division | Team-seasons | Made the playoffs | Rate |
|---|---|---|---|
| 0–6 | 40 | 0 | .000 |
| 1–5 | 100 | 1 | .010 |
| 2–4 | 141 | 12 | .085 |
| 3–3 | 178 | 50 | .281 |
| 4–2 | 160 | 110 | .688 |
| 5–1 | 106 | 95 | .896 |
| 6–0 | 29 | 28 | .966 |
2002–2025, playoff participation read off the same game log. The 14 team-seasons containing a tied division game sit outside these seven rows and are kept in every later calculation, where a tie counts half a win.
Two entries in that table are worth stopping on. Nobody has gone 0–6 in their own division and played a postseason game — forty tries, forty failures, the best of them the 2008 Bills at 7–9. And at the other end, twenty-eight of twenty-nine division sweeps produced a berth; the exception is Oakland in 2010, who beat Kansas City, Denver and San Diego twice apiece, went 8–8 against everyone else's schedule, and stayed home.
Now the honest part. Aggregate that table into winners and losers of the division and the gap is enormous — 236 of 304 (.776) for teams above .500 in division against 14 of 286 (.049) for teams below, a 72.7-point spread. Almost all of it is a restatement of something you already knew: good teams beat everybody, including the three clubs they see twice. The division column and the win column are the same column, mostly. The question is what is left when you take that away.
The Exhibit
Holding the Record Fixed
Restrict to the bubble — the 340 team-seasons that finished with seven, eight, nine or ten wins, which is where berths are handed out and refused. Within it:
- Losing division record: 10 of 74 — 13.5%
- Even, 3–3: 33 of 135 — 24.4%
- Winning division record: 71 of 131 — 54.2%
That still mixes a ten-win team with a seven-win team, so pool the four win totals separately and weight each stratum by n_low × n_high / (n_low + n_high). The stratified difference between a winning and a losing division record, at identical overall records, is +15.03 percentage points. It is present in all four strata: +14.3 at seven wins (0 of 32 against 2 of 14), +14.2 at eight (1 of 22 against 6 of 32), +23.8 at nine (3 of 13 against 15 of 32), and a compressed +4.9 at ten, where 86% of the losing-division group got in anyway and there was not much room left to gain.
The nine-win row is the one to keep. Nine wins is the modern bubble — the seventeenth game moved the league's most common season there — and at nine wins the split between 4–2 and 2–4 in your own division is worth about twenty-four points of playoff probability.
Pricing the Two Columns
The cleanest statement of the effect is to let the two columns have their own coefficients. Fit a logistic regression across all 768 team-seasons with three inputs — division win credit, non-division win credit, and a flag for the seventeen-game seasons — predicting a playoff berth:
| Term | Coefficient | SE | Odds multiplier per win |
|---|---|---|---|
| Division win | +2.4843 | 0.2471 | 11.99× |
| Non-division win | +1.9107 | 0.1839 | 6.76× |
| 17-game season | +0.1269 | 0.3743 | 1.14× |
The difference between the first two rows is +0.574 with a standard error of 0.168 — z = +3.41, which is not a coincidence at this sample size. In ratio terms a division win is worth 1.30 non-division wins. The seventeenth game, on its own, does nothing measurable; that term exists only so the 2021–2025 seasons do not contaminate the two that matter.
The worked example. Take a nine-win team in a seventeen-game season and move two wins from one column to the other. At 5–1 in the division and 4–7 outside it, the fit says 66.8%. At 3–3 in the division and 6–5 outside it — the same nine wins — it says 39.0%. That is a 27.8-point swing bought entirely by which opponents the wins came against. Run the same exercise at eight wins and it is 23.0% against 8.7%.
The mechanism is not mysterious, and it is two-sided. A division win is the only kind that moves a direct rival's record in the opposite direction at the same time, so it swings a four-team race by two games rather than one. And when the standings finish level, the league's published tie-breaking procedures go to head-to-head results first and division record immediately after — so the same six games are also the first two tiebreakers. Four of the six postseason spots in each conference — seven since 2020 — are division titles by rule, and those titles are settled by exactly this arithmetic.
What It Looks Like in the File
Twelve team-seasons since 2002 won ten or more games and missed the playoffs; seven of the twelve were .500 or worse in their own division. The 2008 Patriots are the standing example — 11–5, 4–2 in the AFC East, and out. Eleven team-seasons went the other way and made it with eight wins or fewer; seven of those eleven had a winning division record, including Seattle's 7–9 in 2010 and Washington's 7–9 in 2020, both 4–2 inside a division that could not produce anyone better. Carolina's 8–9 in 2025 was 3–3.
Note also what the average has to be. Division games are zero-sum inside the division, so the mean division record across all 768 team-seasons is exactly 3–3. Nobody can raise the league's division-win total. This is a statement about where a fixed pool of wins lands, not about a strategy any front office can adopt.
Week 1 of 2026, and the Five
The 2026 schedule carries 96 division games out of 272 — 35.3% of the season — and five of them are on the opening board:
| Game | Date | Model's pick | Probability |
|---|---|---|---|
| San Francisco at LA Rams (neutral site, Melbourne) | Sep 10 | LA | .5789 |
| Green Bay at Minnesota | Sep 13 | MIN | .5970 |
| Washington at Philadelphia | Sep 13 | PHI | .7280 |
| Dallas at NY Giants | Sep 13 | NYG | .5096 |
| Denver at Kansas City | Sep 14 | DEN | .4195 |
Probabilities are the home team's, frozen in the ledger on August 12, 2026 and graded as written. Denver's row is below .5000 because the model favors the visitor.
Two things stand out. The first division game of the 2026 season is played in Australia, where the model waives the home-field allowance entirely — the international-games page owns that waiver. And the five are collectively the hard part of the week: they average 59.9% confidence against 62.0% for the full sixteen-game board, and they carry 2.01 of the week's expected wrong picks between them. Dallas at the Giants, at .5096, is the closest thing to a coin flip anyone will price all weekend, and it is a division game. That is the pattern this page predicts: the games that matter most in the standings are the ones a rating system can say least about, because familiar opponents in the same division tend to be close to each other in strength.
What This Page Cannot Tell You
- It is not causal, and it cannot be. Beating your division twice is partly a measurement of how weak your division is. A 5–1 record inside a bad division and a 5–1 record inside a good one are the same row here and are not the same achievement. Controlling for that properly needs an opponent-strength adjustment, which has its own page and is not folded in here.
- Berths are the outcome, not seeding. This page counts appearing in a postseason game. It does not distinguish a top seed from a wild card, and it says nothing about how far a team went once it got there — the champions page handles that question.
- The field changed size mid-sample. Twelve teams qualified through 2019 and fourteen from 2020, which raises the baseline berth rate for the last six seasons. The stratified estimate is computed inside win-total strata, which absorbs most of it, but not all.
- Ties are handled by convention. A tie counts half a win in both columns. Fourteen team-seasons contain a tied division game and are excluded only from the seven-row gradient table, never from the estimates.
- The 1.30 ratio is an average over a specific era. It comes from 2002–2025 with four-team divisions and the current tiebreakers. Change the playoff format again and this number moves; the 2020 expansion to fourteen teams already softened it at the top of the bubble.
Reproduce It
One public file, games.csv from nflverse nfldata, bundled at /data/games.csv, plus this site's frozen ledger at /data/predictions.json for the five 2026 rows. The whole study and the chart come from explainer_src/make_division_leverage_chart.py. The core is short:
import pandas as pd

g = pd.read_csv("data/games.csv")
reg = g[(g.game_type == "REG") & g.home_score.notna()
        & g.season.between(2002, 2025)]

# who played in January, straight from the file
post = g[(g.game_type != "REG") & g.home_score.notna()]
made = set(zip(post.season, post.home_team)) | set(zip(post.season, post.away_team))

long = pd.concat([
    reg.assign(team=reg.home_team, me=reg.home_score, opp=reg.away_score),
    reg.assign(team=reg.away_team, me=reg.away_score, opp=reg.home_score)])
long["cr"] = (long.me > long.opp) * 1.0 + (long.me == long.opp) * 0.5

t = long.groupby(["season", "team"]).apply(lambda d: pd.Series({
    "wins": d.cr.sum(),
    "divw": d.loc[d.div_game == 1, "cr"].sum()}))
t["playoff"] = [i in made for i in t.index]

bubble = t[t.wins.between(7, 10)]
side = bubble.divw.map(lambda d: "losing" if d < 3 else ("even" if d == 3 else "winning"))
print(bubble.groupby(side).playoff.agg(["size", "mean"]))   # .135 / .244 / .542
The script also asserts every published figure — the seven gradient rows, the 2010 Raiders, all four strata and the pooled difference, the three logistic coefficients with their standard errors and the standard error of their difference, both worked examples, the six named team-seasons, and all five 2026 rows against the frozen ledger: 111 assertions, all green as of September 5, 2026.
Further reading
- The Model Gets Louder, Not Smarter — today's companion: what sixteen seasons of grading say about how much the ledger knows in September
- Division Games and Home Field — the same six games measured a different way: familiarity shrinks the home edge
- Does Winning the Division Mean Anything Next Year? — what the crown predicts once you have it
- Week 1 Predictions, By the Numbers — all sixteen openers priced, the five above included
- Elo-Implied 2026 Playoff Odds — the simulation these historical rates should be read against
- One-Score Records Are Luck — why a 4–2 division record built on three field goals should not be over-read
- Power Rankings and the prediction ledger — where the five week-1 numbers came from, and where they get graded
- Data: the nflverse games file bundled at
/data/games.csv; playoff participation derived from the file's own non-regular-season rows. Tie-breaking procedure as published by the NFL.
Go deeper
Want the code behind these metrics? Work through the 43-chapter NFL analytics tutorial.
Browse tutorials Free tools