The Board Opens Quiet, and Stays About as Right
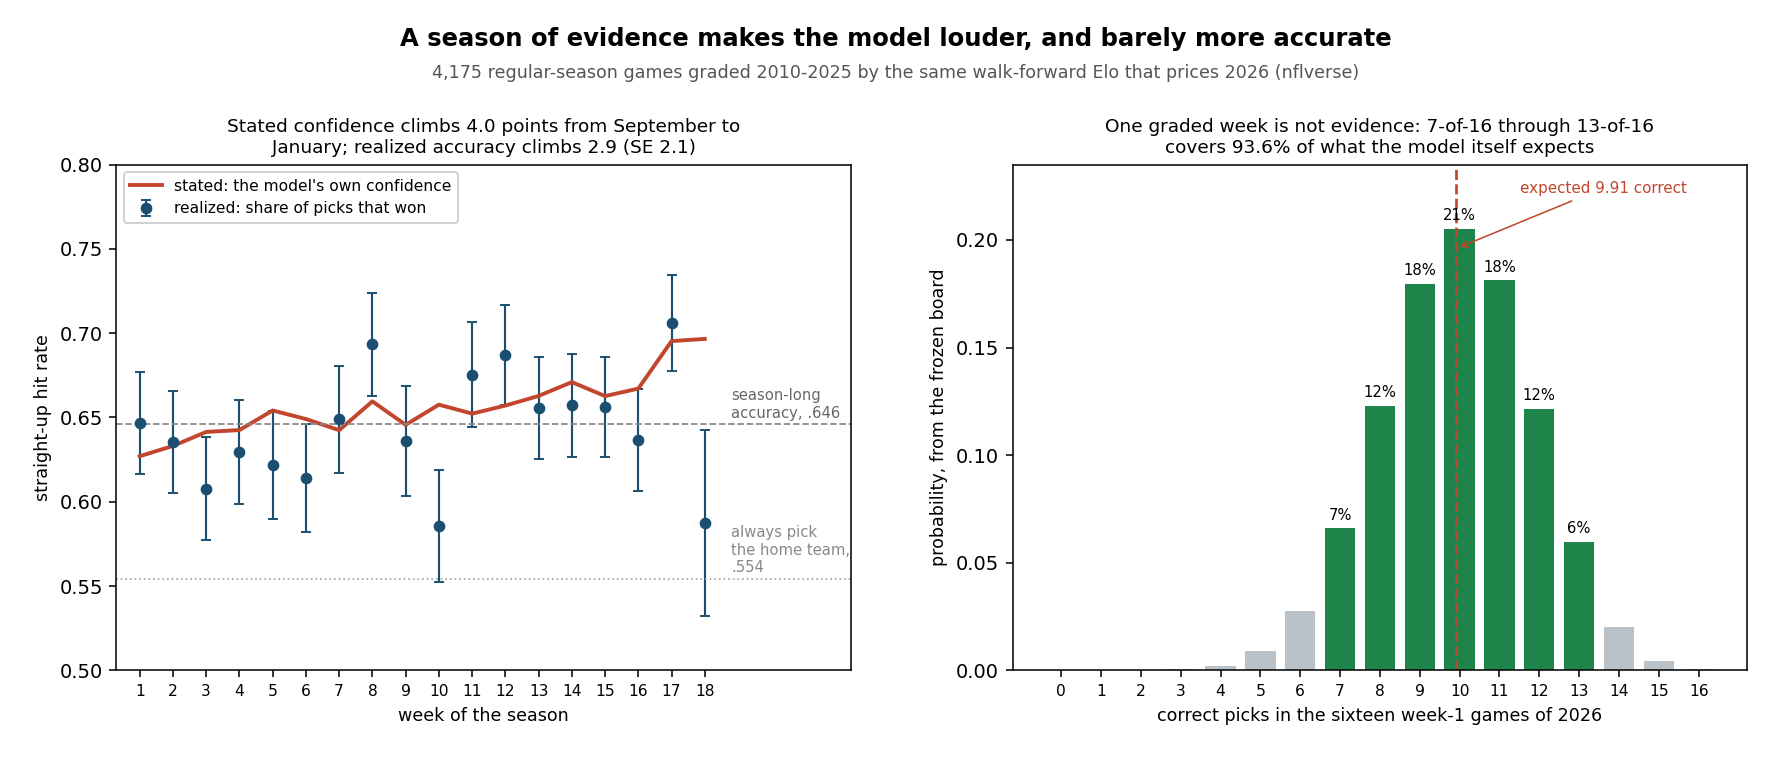
Four days from now the ledger's frozen week-1 board gets graded for the first time, and the standard objection arrives with it: those ratings were locked on August 12 off last season's scores, so of course September is the model's worst month. It sounds obviously true. It is not. I split every game the engine has ever graded — 4,175 regular-season games from 2010 through 2025 — by week of the season rather than by season, and the model's straight-up hit rate in weeks 1 to 4 is .6299 against .6584 in weeks 14 to 18. That is a gain of 2.86 percentage points with a standard error of 2.09, which does not clear two.
What does change, and by more, is how loudly the model asserts itself. Its own stated confidence — the average of max(p, 1−p), meaning the hit rate it claims in advance — rises from .6360 to .6757 over the same span, a 3.97-point climb. A season of evidence buys the model conviction slightly faster than it buys accuracy. Which is the useful thing to know before Wednesday: the number next to a week-1 game is not a worse forecast than the number next to a week-15 game. It is a quieter one, and it is quieter for the right reason.
How the Replay Works
The engine is the one this site published in full: walk-forward Elo, K = 20, home field +48, a margin multiplier, one-third regression toward 1505 between seasons. The harness behind this page imports that module rather than reimplementing it, so the figures here cannot drift from the model they describe. It walks the bundled game log from 1999, prices each game before feeding it, and starts grading in 2010 after an eleven-season burn-in — identical to the published backtest, which the replay reproduces to the game: 4,363 graded, 4,175 regular season and 188 postseason.
Then the only new step. Instead of grouping by season, group by week. Each bucket gets two numbers: how often the pick actually won, and how often the model said it would. If the engine understood its own ignorance, those two lines should track each other in every week, and the first line should climb only as fast as the model has actually learned something.
The Exhibit
Four Buckets, Two Numbers Each
| Weeks | Games | Realized | Stated | Gap | Brier |
|---|---|---|---|---|---|
| 1–4 | 1,011 | .6299 | .6360 | −0.6 | .2257 |
| 5–9 | 1,128 | .6427 | .6502 | −0.8 | .2202 |
| 10–13 | 944 | .6521 | .6575 | −0.5 | .2184 |
| 14–18 | 1,092 | .6584 | .6757 | −1.7 | .2175 |
2010–2025 regular season. Gap is realized minus stated, in percentage points; every one of the four sits inside two standard errors of zero. Brier is the average squared distance between the stated probability and the result, lower being better.
Read the gap column first. The model is honest in all four windows: it never claims materially more than it delivers, early or late. The largest shortfall is the last bucket at 1.7 points, and even that is 1.2 standard errors from nothing. So the confidence it gains through a season is not empty confidence — it is mostly earned, just very slightly ahead of itself.
Now read the accuracy column against the Brier column. Brier improves monotonically, .2257 to .2175, which is the real signal: as ratings absorb the season, the probabilities get sharper even where the pick does not flip. Straight-up accuracy is the coarser instrument, and it moves less because most games the extra information affects were already going to be called the same way.
Week by week the picture is noisier still and worth seeing plainly. Week 1 has gone .6468 across sixteen openers — above the model's season-long .6458, and better than nine of the other seventeen weeks. The single worst week in the file is week 10 at .5856, deep in the part of the calendar where the model claims to know most. The best is week 17 at .7059. Week 18 is the ugly outlier — .5875 on 80 games, against a stated .6966, the model's loudest and weakest week at once. Resting starters is the obvious suspect and this page does not test it; note only that if that were the whole story, week 17 in the eleven sixteen-game seasons should look the same and it is instead the best week in the file.
One Week Is Not Evidence
The corollary matters more than the finding. If you plan to judge this ledger on Monday morning, here is the arithmetic that says you cannot. Take the sixteen openers the model has graded, one season at a time: the mean is .6479 and the season-to-season standard deviation is 10.22 percentage points. Pure coin-flip noise on a sixteen-game week at the model's own long-run rate is 11.96 points. The observed scatter is smaller than chance alone predicts, which is to say opening weeks contain no visible signal about anything beyond themselves. The best was 2019 at 13 of 15. The worst was 2021 at 6 of 16. Both came out of the same engine with the same long-run accuracy.
So here is the grading frame for Wednesday through Monday, published before kickoff. The 2026 board's sixteen games average 61.96% stated confidence — slightly below the .6270 the model has averaged in past openers, so it is being unusually careful this year. Multiply through and it expects 9.91 correct picks and 6.09 misses, the first installment of the season's 99-miss budget. Because the sixteen probabilities differ, the exact distribution is Poisson-binomial rather than binomial; computed from the frozen board it has a standard deviation of 1.92 games, a single most likely score of 10 of 16 (20.5%), and a central band from 7 to 13 correct that holds 93.6% of the probability mass. Going 14-and-2 is a 2.5% event. Going 6-and-10 is 3.9%.
Which means: any Monday result between 7-9 and 13-3 tells you nothing you did not already know. That is not an excuse arranged in advance — it is the same arithmetic that makes a 13-3 week no proof of anything either.
What Would Actually Count
The model's real claim is narrow: it beats the naive rule of always picking the home team. Over 4,162 decided regular-season games that rule went .5543 and the model went .6458, an edge of 9.15 points. To put two standard errors between those two rates takes about 109 games — call it seven weeks, so somewhere around Halloween the 2026 grade starts being able to say something.
And even a whole season is a blunt instrument. The standard error of an accuracy estimate over a full 272-game schedule is 2.90 points, so a season that finishes at .620 and a season that finishes at .676 are the same season as far as the evidence goes. Sixteen backtested seasons are what let the model claim .6458 at all; one is a data point. The ledger is public and the rows are frozen because that is the only way the count ever gets large enough to mean anything, not because any single week will settle it.
What This Page Cannot Tell You
- A null is not a zero. The September-to-January accuracy gain is +2.86 points with a 95% interval running from −1.3 to +7.0. A real improvement of three or four points is entirely consistent with this file; what is ruled out is the large early-season penalty the objection assumes.
- Week is a crude proxy for information. A week-6 game after a team's bye and a week-6 game after a short week carry different amounts of new evidence, and this cut ignores that. Rest has its own page.
- The 2020 season sits inside the sample. Empty stadiums moved home field enough to be visible, and those games are pooled here with every other season rather than flagged.
- Week 18 is five seasons deep and no more. Eighty games, one standard error of about 5.5 points, and a genuine structural oddity in what teams field. Do not read the .5875 as a finding.
- Straight-up accuracy is a lossy summary. It throws away the size of the probability, which is why the Brier column is in the table. A model can improve materially without moving its hit rate at all, and between September and January this one partly does.
- This says nothing about the market. Beating the closing spread is a different and much harder bar, and no figure on this page is evidence about it.
Reproduce It
Two files: games.csv from nflverse nfldata, bundled at /data/games.csv, and this site's frozen ledger at /data/predictions.json. The study and both panels come from explainer_src/make_season_learning_chart.py, which imports the live engine instead of copying it:
import nfl_elo as E

eng, graded = E.Engine(), []
for r in E.load_games():                    # chronological
    if not E.played(r):
        continue
    p = eng.predict(r)                      # priced before it is seen
    o = 1.0 if int(r["home_score"]) > int(r["away_score"]) else (
        0.0 if int(r["home_score"]) < int(r["away_score"]) else 0.5)
    if int(r["season"]) >= E.GRADE_FROM:    # 2010
        graded.append((int(r["week"]), r["game_type"], p, o))
    eng.feed(r)

reg = [g for g in graded if g[1] == "REG"]
for lo, hi in ((1, 4), (5, 9), (10, 13), (14, 18)):
    b = [g for g in reg if lo <= g[0] <= hi]
    d = [g for g in b if g[3] != 0.5]
    print(lo, hi,
          sum((g[2] >= .5) == (g[3] == 1.) for g in d) / len(d),   # realized
          sum(max(g[2], 1 - g[2]) for g in b) / len(b))            # stated
The script asserts every figure above — the engine's constants, the replay against the stored backtest, all eighteen weekly rows, the four buckets with their gaps and standard errors, the season-by-season opening-week spread against binomial noise, the seven-week separation threshold, and the full Poisson-binomial distribution for 2026's opening sixteen: 95 assertions, all green as of September 5, 2026.
Further reading
- The Six Games That Count Double — today's companion: why five of Sunday's games are worth more in the standings than the other eleven
- Our Prediction Model, Fully Stated — the engine, the constants, and the overall calibration curve this page slices by week
- The Miss Budget — the 99 wrong picks the season owes, and week 1's 6.09 of them
- Week 1 Predictions, By the Numbers — the sixteen rows being graded on Monday
- Does Week 1 Mean Anything? — the same "one week is not evidence" argument, applied to teams instead of to the model
- Favorite Win Rate by Spread — what a stated probability is worth when the market states it instead
- The prediction ledger and power rankings — the frozen rows, and the ratings behind them
- Data: the nflverse games file bundled at
/data/games.csv; grades produced byexplainer_src/nfl_elo.py, the same module that writes the live ledger.
Go deeper
Want the code behind these metrics? Work through the 43-chapter NFL analytics tutorial.
Browse tutorials Free tools