Every Team's Playoff Chances, After Week 5
Updated with every build. Results through Monday, : 79 of 272 regular-season games played, 193 left. Week 6 is next.
Jump to: AFC · NFC · How the odds are made · 2026 standings · power rankings
AFC Playoff Odds 2026
| Team | Division | Record | Elo | Playoffs % | Division % | #1 seed % |
|---|---|---|---|---|---|---|
| Jacksonville Jaguars | South | 4–1 | 1621 | 96.8 | 93.8 | 27.9 |
| Buffalo Bills | East | 4–1 | 1655 | 95.7 | 74.7 | 28.4 |
| Kansas City Chiefs | West | 4–0 | 1581 | 88.4 | 58.8 | 13.9 |
| Baltimore Ravens | North | 4–1 | 1584 | 84.8 | 56.9 | 12.3 |
| Denver Broncos | West | 3–2 | 1603 | 80.3 | 39.3 | 7.0 |
| New England Patriots | East | 3–2 | 1603 | 77.4 | 25.1 | 6.0 |
| Cincinnati Bengals | North | 3–2 | 1520 | 61.3 | 22.8 | 2.6 |
| Pittsburgh Steelers | North | 3–2 | 1528 | 48.7 | 14.6 | 1.5 |
| Cleveland Browns | North | 3–2 | 1433 | 24.8 | 5.7 | 0.3 |
| Indianapolis Colts | South | 2–3 | 1458 | 15.0 | 3.3 | 0.1 |
| Houston Texans | South | 1–4 | 1534 | 14.0 | 2.9 | 0.1 |
| Las Vegas Raiders | West | 3–2 | 1418 | 11.1 | 1.9 | 0.0 |
| New York Jets | East | 2–3 | 1382 | 1.6 | 0.2 | 0.0 |
| Los Angeles Chargers | West | 0–5 | 1433 | 0.2 | 0.0 | 0.0 |
| Miami Dolphins | East | 0–5 | 1374 | 0.1 | 0.0 | 0.0 |
| Tennessee Titans | South | 0–5 | 1284 | 0.0 | 0.0 | 0.0 |
NFC Playoff Odds 2026
| Team | Division | Record | Elo | Playoffs % | Division % | #1 seed % |
|---|---|---|---|---|---|---|
| San Francisco 49ers | West | 5–0 | 1651 | 98.9 | 78.0 | 49.8 |
| Minnesota Vikings | North | 5–0 | 1632 | 97.9 | 81.3 | 36.8 |
| Seattle Seahawks | West | 3–2 | 1670 | 87.9 | 18.9 | 8.3 |
| Detroit Lions | North | 3–2 | 1559 | 63.2 | 10.5 | 2.1 |
| Philadelphia Eagles | East | 2–3 | 1536 | 54.3 | 48.9 | 0.5 |
| Los Angeles Rams | West | 2–3 | 1585 | 49.1 | 3.1 | 0.8 |
| Green Bay Packers | North | 3–2 | 1531 | 44.8 | 4.5 | 0.8 |
| New York Giants | East | 3–1–1 | 1455 | 41.1 | 35.7 | 0.3 |
| Chicago Bears | North | 3–2 | 1540 | 40.1 | 3.7 | 0.6 |
| Carolina Panthers | South | 2–2 | 1454 | 38.0 | 36.9 | 0.1 |
| Atlanta Falcons | South | 2–3 | 1468 | 37.8 | 36.5 | 0.0 |
| Tampa Bay Buccaneers | South | 1–4 | 1450 | 18.6 | 18.0 | 0.0 |
| Dallas Cowboys | East | 2–3 | 1448 | 14.0 | 11.1 | 0.0 |
| New Orleans Saints | South | 1–4 | 1389 | 8.8 | 8.6 | 0.0 |
| Washington Commanders | East | 1–3–1 | 1414 | 5.3 | 4.3 | 0.0 |
| Arizona Cardinals | West | 1–4 | 1367 | 0.3 | 0.0 | 0.0 |
How the odds are made
- The site's plain season simulation plays the rest of the 2026 schedule 20,000 times. Games already played keep their real results (a tie counts half a win for each side); every other game is drawn from the two teams' current Elo ratings, with the usual 48-point edge for the home team and none at a neutral site.
- Each conference seats its four division winners and three wild cards by winning percentage. Ties in the standings are broken at random, not by the NFL's tiebreakers. The #1 seed is the conference's best record in that simulated season.
- The ratings are the ones on the power rankings page and in data/predictions.json; records come from the 2026 standings. The random seed is fixed, so the same results always give the same odds, and the numbers only move when a game is played.
- 0.0 means fewer than 10 of the 20,000 seasons, and 100.0 means all but fewer than 10. The simulation treats each rating as exact, which makes it too sure of itself at both ends: the week-1 check of past seasons found very high odds came true less often than stated, and very low odds more often; one correction for that is tested here.
- Every team's numbers as data: data/playoff-odds-2026.json. Game-by-game probabilities are on the predictions page; the schedule each team has left is ranked on the strength-of-schedule page.
The Preseason Run (August 20, 2026)
Everything below is this page's original preseason analysis, published on August 20 from the frozen opening ratings before any 2026 game was played. It is kept as it was, so the odds above can be read against where the season started.
From Expected Wins to Actual Odds
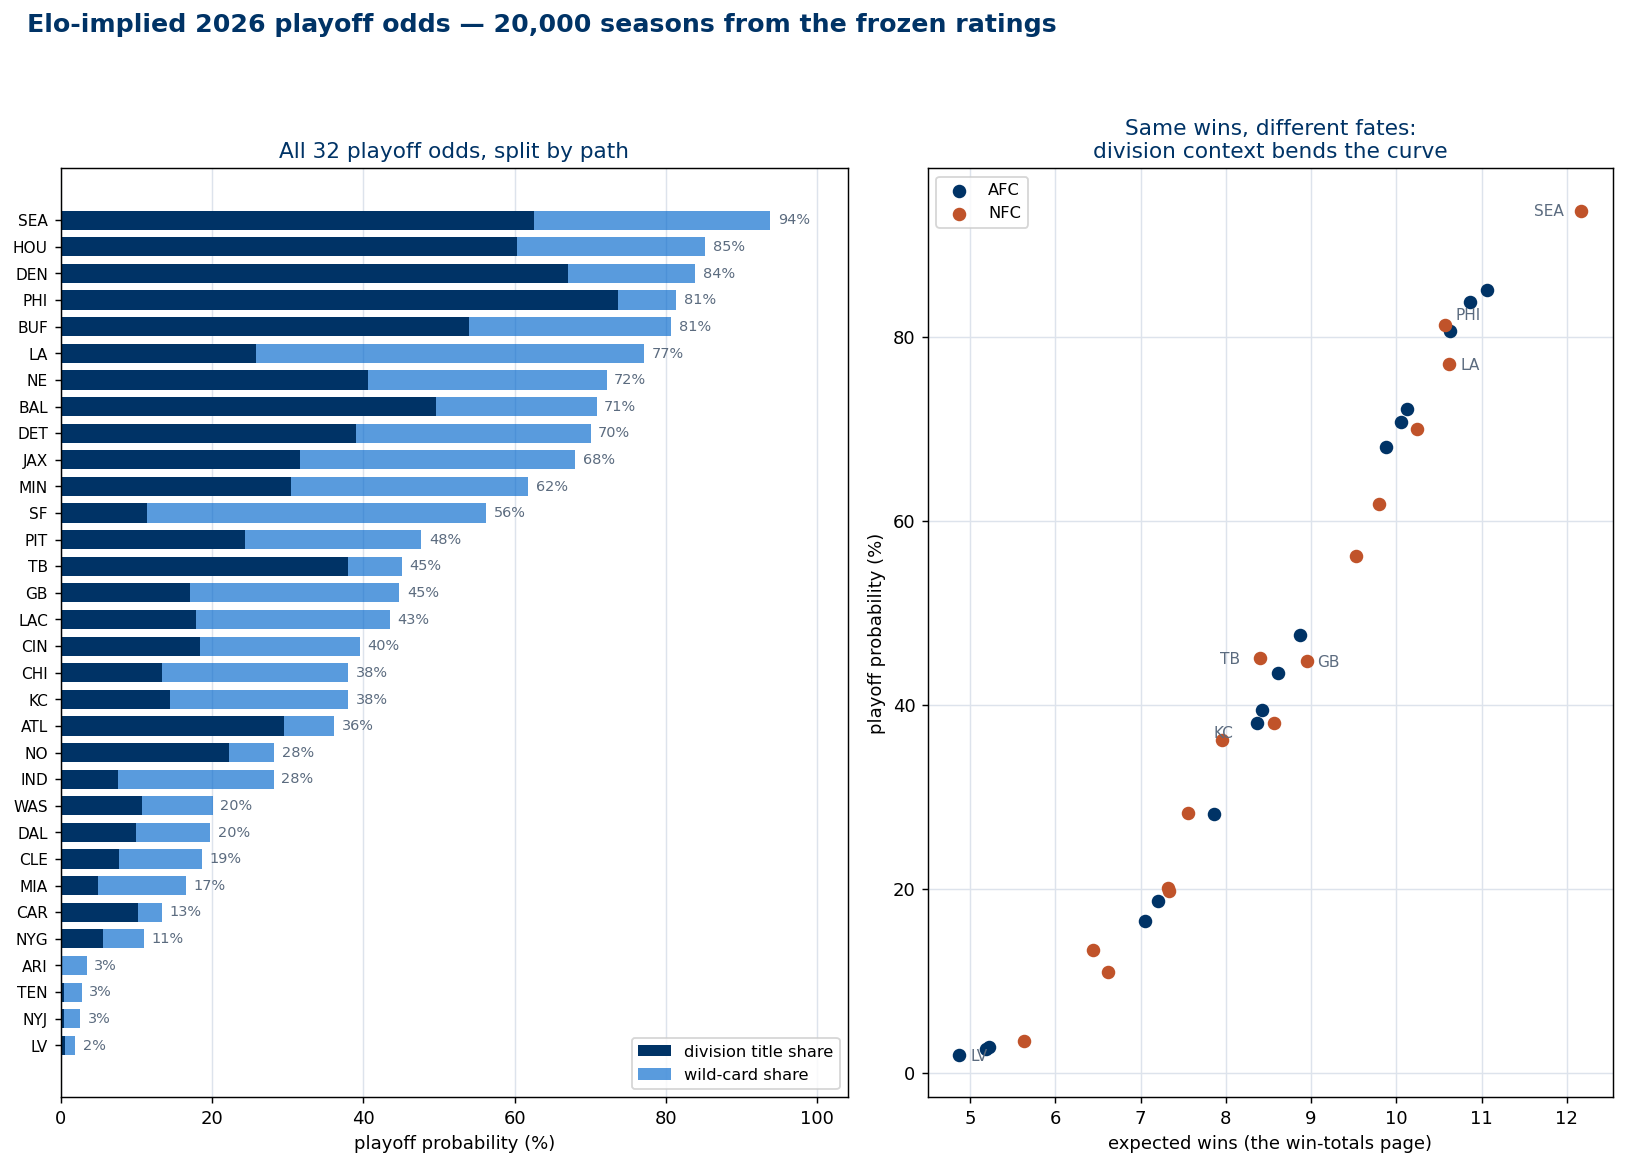
This is the third rung of one ladder. The prediction ledger turns the site's frozen opening ratings into a win probability for every 2026 game and grades itself weekly. The win-totals page sums those probabilities into each team's expected wins — Seattle 12.2, Las Vegas 4.9. But expected wins dodge the question fans actually ask, because the playoffs don't admit teams for win totals; they admit four division winners and three wild cards per conference, and which division you're in changes what ten wins buys. So this page plays the whole 2026 season out 20,000 times and counts what happens.
The Machine, Stated Fully
Each simulated season draws every one of the 272 scheduled games as an independent coin weighted at the model's probability — the identical logistic-in-the-rating-gap arithmetic the ledger publishes, with its +48 Elo home edge waived for the schedule's eight neutral-site games. Records are tallied; each division's best record wins it; the three best non-winners per conference take the wild cards; the best division winner takes the 1 seed. Repeat 20,000 times from a fixed seed (2026, for reproducibility) and the frequencies are the odds.
One simplification is big enough to disclose in bold: ties are broken uniformly at random. The real NFL tiebreaker ladder starts with head-to-head and walks through division and common-games records; simulating it faithfully would change which specific team survives some knife-edge seasons. Averaged over 20,000 seasons the distortion is small — but a team whose playoff hopes rest on winning coin-flip tiebreakers should treat its number here as having a point or two of fuzz. Everything else inherits the win-totals page's honesty budget: the ratings are frozen at their opening values, know nothing about injuries or August news, and carry a ±2-win binomial band on any single season even if they're exactly right.
The Exhibit: Every Team's Odds, and Why Wins Aren't Fate
| Team | Expected wins | Playoff % | Division % | 1 seed % |
|---|---|---|---|---|
| Seattle | 12.17 | 93.8 | 62.5 | 40.4 |
| Houston | 11.06 | 85.2 | 60.2 | 21.9 |
| Denver | 10.86 | 83.9 | 67.0 | 19.3 |
| Philadelphia | 10.57 | 81.3 | 73.6 | 13.0 |
| Buffalo | 10.63 | 80.7 | 54.0 | 16.2 |
| L.A. Rams | 10.62 | 77.0 | 25.9 | 14.8 |
| New England | 10.12 | 72.1 | 40.6 | 10.4 |
| Baltimore | 10.06 | 70.8 | 49.5 | 10.6 |
| Detroit | 10.24 | 70.0 | 39.1 | 9.3 |
| Jacksonville | 9.88 | 68.0 | 31.6 | 9.1 |
| Minnesota | 9.80 | 61.8 | 30.5 | 6.7 |
| San Francisco | 9.52 | 56.2 | 11.4 | 5.4 |
| Pittsburgh | 8.87 | 47.7 | 24.3 | 3.5 |
| Tampa Bay | 8.40 | 45.1 | 37.9 | 1.8 |
| Green Bay | 8.95 | 44.7 | 17.0 | 3.1 |
| L.A. Chargers | 8.61 | 43.5 | 17.9 | 2.8 |
| Cincinnati | 8.43 | 39.5 | 18.4 | 2.2 |
| Chicago | 8.57 | 38.0 | 13.4 | 2.4 |
| Kansas City | 8.37 | 38.0 | 14.5 | 1.8 |
| Atlanta | 7.96 | 36.2 | 29.5 | 1.1 |
| New Orleans | 7.56 | 28.2 | 22.3 | 0.6 |
| Indianapolis | 7.86 | 28.2 | 7.6 | 1.2 |
| Washington | 7.32 | 20.1 | 10.8 | 0.6 |
| Dallas | 7.33 | 19.8 | 10.0 | 0.5 |
| Cleveland | 7.21 | 18.7 | 7.7 | 0.6 |
| Miami | 7.05 | 16.6 | 4.9 | 0.4 |
| Carolina | 6.44 | 13.3 | 10.3 | 0.2 |
| N.Y. Giants | 6.62 | 11.0 | 5.6 | 0.2 |
| Arizona | 5.64 | 3.4 | 0.2 | 0.0 |
| Tennessee | 5.23 | 2.8 | 0.5 | 0.0 |
| N.Y. Jets | 5.19 | 2.6 | 0.5 | 0.0 |
| Las Vegas | 4.87 | 2.0 | 0.6 | 0.0 |
What the Division Does to a Team's Fate
The right-hand scatter is the page's real lesson: expected wins buy different amounts of October depending on the neighborhood. Three worked pairs:
- The Rams' tax. L.A. carries the sixth-best expected wins in football (10.6) and just a 26% division shot — the lowest division share of any 70%-plus playoff team — because Seattle shares the NFC West. Three-quarters of the Rams' playoff probability arrives through the wild-card door, the highest wild-card dependence of any contender. Good team, wrong address.
- Tampa Bay's discount. Green Bay projects to more wins than Tampa Bay (8.95 to 8.40), yet their playoff odds are identical (44.7% and 45.1%) — and the Bucs are more than twice as likely to win their division (37.9% to 17.0%). A winnable NFC South is worth about half a win of expected-wins deficit, converted at the steepest part of the curve.
- Philadelphia's compounding. The Eagles' 73.6% division share is the league's highest — higher than Seattle's — on two fewer expected wins, because the NFC East's next-best team projects to 7.3. Weak divisions concentrate odds on their one good team.
The curve's slope is the other number worth carrying: through the middle of the table, one expected win moves playoff odds by roughly 13 percentage points — which is why the schedule bends of a half-win, invisible in a record, are entirely visible in October math.
Reading the Odds Like the Ledger Will
A few numbers on this page are bets the model is making in public. Kansas City at 38% is the coldest: the frozen ratings carry the Chiefs' 2025 into 2026 with a third of it regressed away and see a coin-flip team in Denver's division. New England at 72% is the warmest surprise on the other side. The mean last-team-in wins 9.3 games in the AFC and 9.5 in the NFC — so ten wins is probably safe and nine is a sweat, exactly the historical shape — and the average 1 seed lands at 13.2. None of these are opinions to argue with in the comments; all of them are checks the ledger will cash weekly from September 10 onward, the same way it grades every game probability it publishes. When the season disagrees with this page, the disagreement gets measured, not explained away.
Method notes: 20,000 simulated seasons, fixed seed, from the frozen opening ratings and the published 272-game schedule (eight neutral-site games carry no home edge). Ties broken uniformly at random — a stated simplification of the NFL's head-to-head-first tiebreaker ladder. Odds are conditional on the ratings; the ratings know nothing after the 2025 season ended. Every number regenerates deterministically from explainer_src/make_playoff_odds_chart.py.
Go deeper
Want the code behind these metrics? Work through the 43-chapter NFL analytics tutorial.
Browse tutorials Free tools