Four Road Favorites, and Nothing Wrong With Any of Them
The ledger's frozen board for week 1 favors the visitor in four games — Baltimore at Indianapolis, Chicago at Carolina, Miami at Las Vegas, Denver at Kansas City — and every September somebody treats that as a warning sign, as if a favorite loses something at the airport. So I went and measured it. Across 6,871 regular-season games at true home sites from 1999 through 2025, once you match a traveling favorite against a home favorite laying the same number, the traveler wins straight up 1.3 percentage points more often, with a standard error of 1.2. That is nothing. The road-favorite discount does not exist, and the raw statistic that seems to show one is an artifact of which teams get to be big favorites in the first place.
This page is the population study behind that claim, and then its application to the sixteen openers. The companion piece today, on what 2025 did to Kansas City's rating, takes the single most contested of the four apart.
The Raw Gap, and Why It Is a Mirage
Start with the number that fuels the folklore. Take every regular-season game played at a true home site with a closing spread — 6,901 of them — drop the 30 pick'ems, and split the remaining 6,871 by which side was favored:
- Home favorites: 4,453 games, 3,008–1,438 straight up — .6766
- Road favorites: 2,418 games, 1,560–851 straight up — .6470
That is a 2.95-point gap, and it clears two standard errors (z = +2.46). Stop there and you have a finding. Do not stop there. The average home favorite in this file is laying 5.85 points; the average road favorite is laying 4.49. Home field is worth something like two points, so a team good enough to be favored on the road is, on average, being asked to prove less. The two groups are not comparable, and the gap is measuring the difference in their assignments, not in their travel.
The fix is to compare like with like. Stratify on the exact closing number — every 1.5-point favorite against every other 1.5-point favorite, every 7-point favorite against every other — and pool the 35 strata that contain both a home and a road favorite, weighting each by n_home × n_road / (n_home + n_road). The pooled difference comes out to −1.33 percentage points (SE 1.20, z = −1.10). The sign flips, the magnitude collapses, and the result is indistinguishable from zero. Matching on the number is the whole story.
The Exhibit
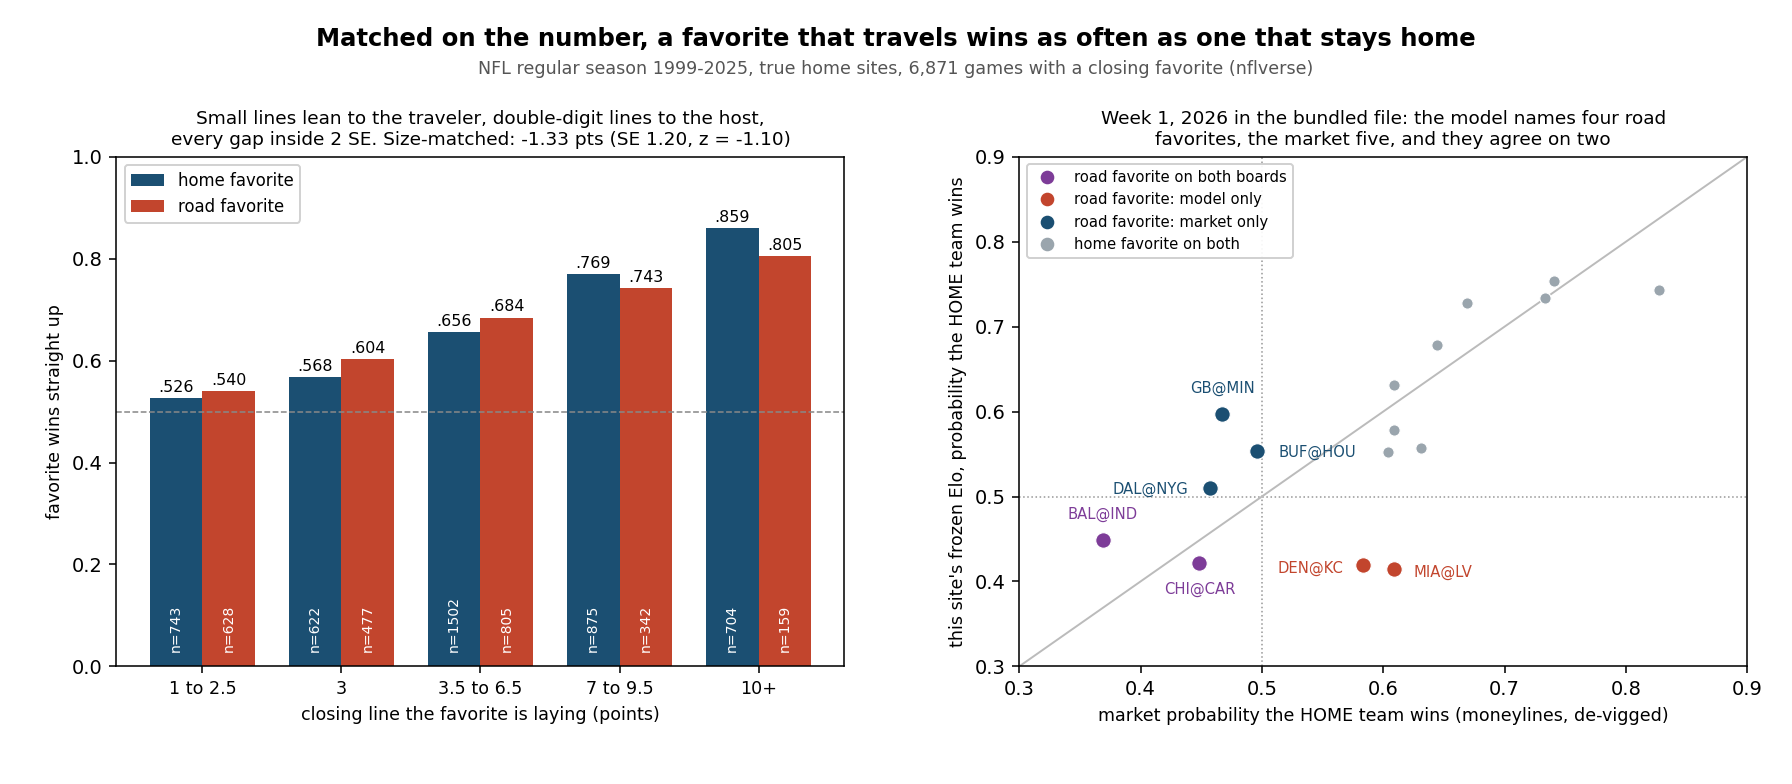
| Closing line | Home favorite | Road favorite | Gap (home − road) |
|---|---|---|---|
| 1 to 2.5 | 391–352 (.526) | 339–289 (.540) | −1.4 |
| 3 | 353–269 (.568) | 288–189 (.604) | −3.6 |
| 3.5 to 6.5 | 986–516 (.656) | 551–254 (.684) | −2.8 |
| 7 to 9.5 | 673–202 (.769) | 254–88 (.743) | +2.7 |
| 10 or more | 605–99 (.859) | 128–31 (.805) | +5.4 |
There is a shape here, and it is worth naming even though none of it is significant. Under a touchdown, the traveler is fractionally the better bet; at double digits, the host is. Every one of those five gaps sits inside two standard errors of zero — the largest is the 10-plus bucket at z = +1.60, on a road sample of just 159 games. If a real effect is hiding in this data, it is small enough that 6,871 games cannot find it, which is another way of saying it is too small to plan around.
Against the Spread, the Host Is the One Coming Up Short
Straight-up records answer the question people ask. The closing line answers a stricter one: is the number itself right? Two ways to check, both on the same population.
First, the margin. Take actual home margin minus the closing spread and average it. Home favorites overshoot their number by +0.14 points per game; road favorites undershoot theirs by 0.07. Both land inside a fifth of a point of the line across a quarter century. Whatever the market is doing with travel, it is not leaving a point on the table.
Second, cover rates. Home favorites are 2,088–2,241 against the spread, 48.23% — 2.3 standard errors below even, and the closest thing to a durable bias in this file. Road favorites are 1,171–1,182, 49.77%, which is a coin. That is the opposite of the folklore: if either kind of favorite has been systematically overpriced since 1999, it is the one that got to sleep at home. This lines up with what the home-and-away page found from the other direction (home teams of all kinds cover 49.0%), and with the long decline in home-field advantage itself. Note the honest limit: 48.23% is a real deviation and still not a betting edge, because the break-even at standard pricing is 52.4%.
Week 1 Specifically, Where the Anxiety Lives
Openers are where the "too many road favorites" line gets said out loud, usually alongside a claim that nobody knows anything yet. So restrict the file to week 1: home favorites 180–94 (.657), road favorites 96–48 (.667). The traveling favorite has the better record of the two, by a point, on 144 games. Both sit almost exactly where favorites of their size sit in any other week.
The count is unremarkable too. Across the 27 completed openers in the file the market has named a road favorite 5.44 times per week 1 on average, median 5, with a range from 2 (2024) to 9 (2015 and 2022); twenty of the 27 had at least five. The bundled 2026 file carries five market road favorites among its fifteen true-home games — the median, exactly. Nothing about this opener is numerically unusual.
And the extreme cases are not scary either. Twelve week-1 road favorites since 1999 have been laying a touchdown or more; they went 9–2–1. The biggest of them all is the 2000 Jaguars, 10.5-point favorites at Cleveland, who won 27–7. The two failures were Dallas at Houston in 2002 (an 8.5-point favorite losing 19–10 to an expansion team in its first game) and Indianapolis at Jacksonville in 2020. The tie is the Colts again, 20–20 at Houston in 2022.
The Four the Model Names, and the Five the Market Does
Now the 2026 application, and it is more interesting than the count. Here is how a road favorite gets built out of ratings. Baltimore is rated 1553.4, Indianapolis 1469.4 — an 84.0-point gap. Home field adds a flat 48 to the host, so the effective comparison is 1517.4 against 1553.4, a 36.0-point deficit for the home team:
p(home) = 1 / (1 + 10^(36.0 / 400)) = 0.4484 → Baltimore 55.16%
That is the ledger's frozen row, reproduced to four decimals. Do the same arithmetic on the other three and the model's road favorites are Chicago at 57.77%, Denver at 58.05% and Miami at 58.57%. None of them is priced above 60%: a road favorite in this model is, by construction, a team whose edge survived a 48-point tax, and not many edges are big enough to survive it by much. The four sum to 2.2955 expected wins — the model expects to lose about 1.7 of these four games, which is the same arithmetic the miss budget runs on the full season.
The market's list is different. Converting the schedule file's own moneyline pairs to probabilities and normalizing each pair to sum to one (proportional de-vig; the sixteen pairs carry 4.31% average hold), the file's market snapshot names five road favorites: Baltimore at Indianapolis, Chicago at Carolina, Buffalo at Houston, Green Bay at Minnesota, Dallas at the Giants. The stored spreads name the identical five, so this is not an artifact of the de-vig method. The two boards agree on exactly two.
| Game | Model p(home) | Market p(home) | Road favorite on… |
|---|---|---|---|
| BAL at IND | .4484 | .3691 | both boards |
| CHI at CAR | .4223 | .4486 | both boards |
| MIA at LV | .4143 | .6092 | model only |
| DEN at KC | .4195 | .5830 | model only |
| BUF at HOU | .5540 | .4957 | market only |
| GB at MIN | .5970 | .4675 | market only |
| DAL at NYG | .5096 | .4573 | market only |
Across all sixteen games the two boards correlate at +0.74 and differ by 6.7 percentage points on average, so this is a broadly similar picture with a few loud arguments. The loud ones are the top two rows of the disagreement: Miami at Las Vegas (19.5 points apart) and Denver at Kansas City (16.4). Those are also, exactly, the two road favorites the model has and the market does not. The week's biggest fights and the week's contested travelers are the same list — which is the honest version of "four road favorites": the count is ordinary, the composition is the argument.
What This Page Cannot Tell You
- A null result is not a proof of zero. The size-matched estimate is −1.33 points with a 95% interval of −3.7 to +1.0. So a road-favorite penalty bigger than about one percentage point is ruled out; anything smaller could be real and invisible in 6,871 games. What the file cannot support is the size of effect the folklore implies.
- The closing line already contains the travel. That is the point, and also the limit: this measures whether the market's travel adjustment is complete, not how large the underlying travel effect is. A road team that is favored has already been debited for the trip. For the raw size of home field, that is its own page; for the specific case of body clocks and short weeks, see rest and scheduling.
- Coast-to-coast trips are not separated out. Every road favorite counts the same here whether it flew 300 miles or 3,000. A distance-split would need a stadium-coordinate join this file does not carry.
- Neutral sites are excluded, and 2026 has one in week 1. San Francisco against the Rams in Melbourne has no home team, so the model waives the 48 and the game does not enter any road-favorite count on this page. The international-games study owns that waiver.
- The market snapshot really is a snapshot. Every 2026 spread and moneyline quoted here is the value stored in the bundled schedule file the site publishes at
/data/games.csv, so the table above reproduces exactly. It is not this morning's live line: a September 4, 2026 pull of the same public nflverse file already had Kansas City moved to −3 and Green Bay at Minnesota off the market's road-favorite list entirely, which would make it four apiece. The model's four cannot move — they were frozen on August 12. The model's numbers cannot move: they were frozen on August 12 and are graded as written.
Reproduce It
One public file, games.csv from nflverse nfldata, bundled at /data/games.csv, plus this site's own frozen ledger at /data/predictions.json. The whole study, every number above, and the chart come from explainer_src/make_road_favorites_chart.py. The core is short:
import pandas as pd

df = pd.read_csv("data/games.csv")
d = df[(df.game_type == "REG") & df.home_score.notna()
       & df.spread_line.notna() & (df.location == "Home")
       & (df.spread_line != 0)].copy()
d["res"] = d.home_score - d.away_score
d = d[d.res != 0]                                   # ties dropped
d["fav_won"] = (d.spread_line > 0) == (d.res > 0)   # nflverse: >0 = home favored
d["road"] = d.spread_line < 0

# the mirage: .6766 vs .6470
print(d.groupby("road").fav_won.mean())

# the fix: match on the exact number, then pool
g = d.groupby([d.spread_line.abs(), "road"]).fav_won.agg(["sum", "count"])
num = den = 0.0
for k, sub in g.groupby(level=0):
    if len(sub) < 2:
        continue
    (hw, hn), (rw, rn) = sub.loc[(k, False)], sub.loc[(k, True)]
    w = hn * rn / (hn + rn)
    num += w * (hw / hn - rw / rn); den += w
print(num / den)                                    # -0.0133
The script also asserts every published figure — the two records, the raw and matched gaps and their standard errors, all five buckets, both cover rates, the week-1 splits, the 27-season count history, the twelve big week-1 road favorites, and all sixteen 2026 rows against the frozen ledger: 106 assertions, all green as of September 4, 2026.
Further reading
- Kansas City Is 17th — today's companion: the most argued-about of the four, taken apart
- Week 1 Predictions, By the Numbers — all sixteen openers priced, including the five model-market disagreements
- Favorite Win Rate by Spread — the underlying curve this page splits in two
- Do Favorites Cover? — the same population against the spread instead of straight up
- Home-Field Advantage — how big the thing being adjusted for actually is, and how it has shrunk
- Point Spread Accuracy — why a quarter-point average error is the sign of a working market
- Power Rankings and the prediction ledger — where the four road favorites came from, and where they get graded
- Data: the nflverse games file bundled at
/data/games.csv(closing spreads and moneylines as recorded; neutral-site games excluded).
Go deeper
Want the code behind these metrics? Work through the 43-chapter NFL analytics tutorial.
Browse tutorials Free tools