Three Points Above a Team That Does Not Exist
This site's model opens 2026 with Kansas City rated 1508.2, seventeenth of thirty-two. The number to hold next to that is 1505: the rating the engine hands a franchise it has never seen. After twenty-seven seasons of evidence, the board separates the Chiefs from a hypothetical expansion team by 3.2 points.
That is the coldest take on the board, and the playoff-odds page already flagged it as such — Kansas City at 38%, on the record since August 20 for the ledger to grade. This page is the explanation. Where did the rating go, how much of the fall was earned, and is the model reading 2025 the way its own published research says 2025 should be read? The answer to that last one is uncomfortable, and I would rather print it than hide it.
Nine Seasons, Then One
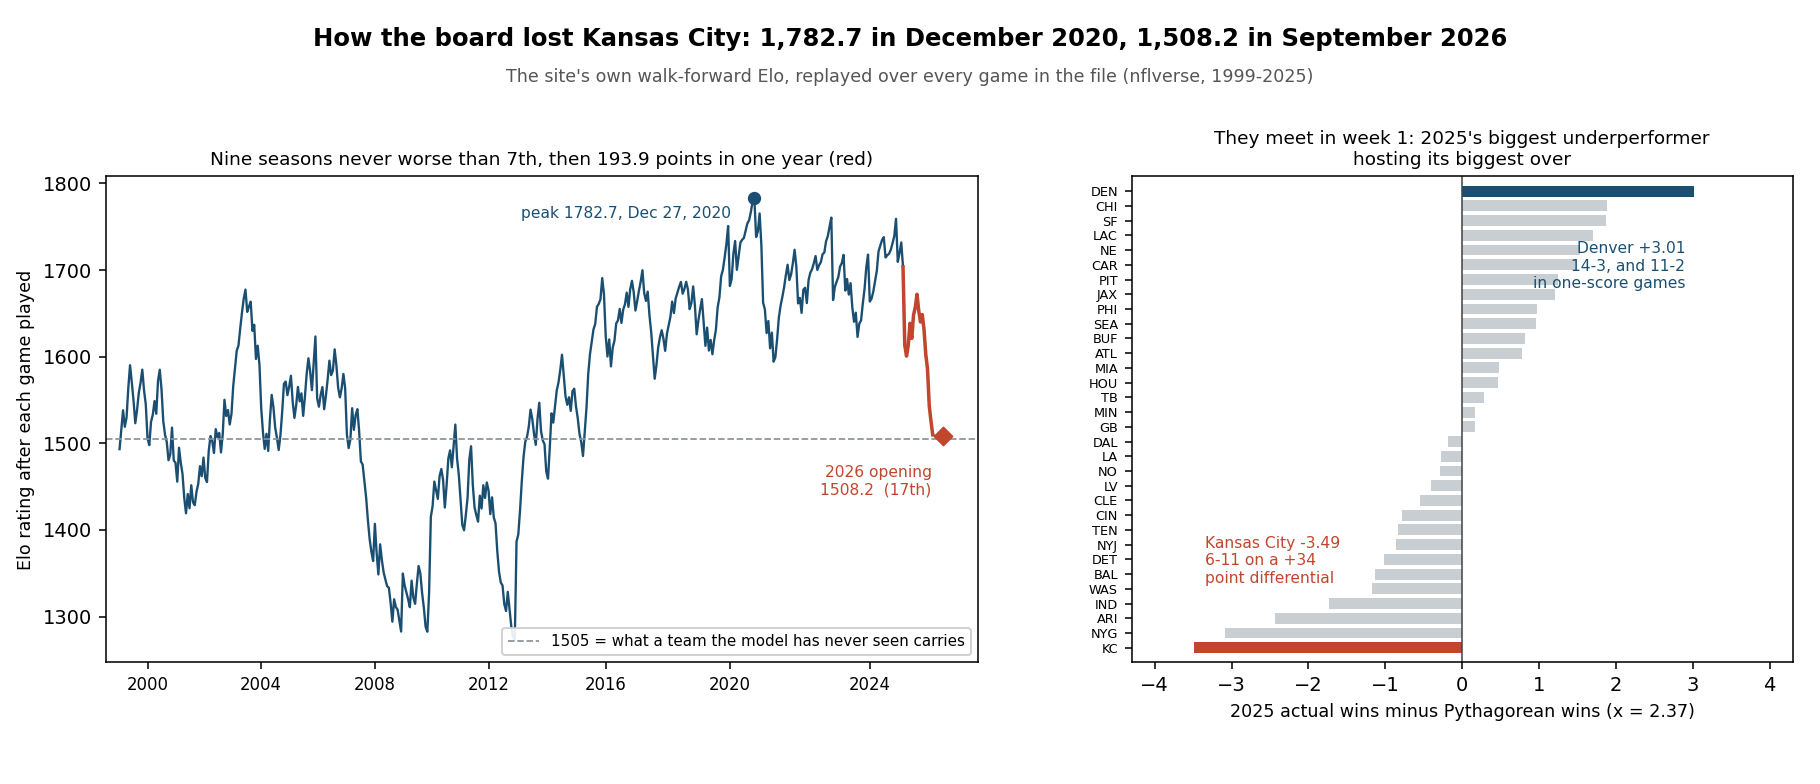
Replay the engine over every game in the file and Kansas City's season-ending rank reads like this from 2016 on: 2nd, 7th, 3rd, 1st, 2nd, 1st, 1st, 1st, 5th — then 17th. Nine straight years in which the model never ranked the Chiefs worse than seventh, four of them finishing first outright, and then one season that undid the whole file's worth of accumulated evidence.
| Season | Rating at year end | League rank | Change on the year |
|---|---|---|---|
| 2016 | 1674.6 | 2 | +2.7 |
| 2017 | 1620.9 | 7 | −53.6 |
| 2018 | 1659.1 | 3 | +38.2 |
| 2019 | 1750.9 | 1 | +91.8 |
| 2020 | 1728.8 | 2 | −22.1 |
| 2021 | 1704.0 | 1 | −24.8 |
| 2022 | 1760.6 | 1 | +56.6 |
| 2023 | 1717.9 | 1 | −42.7 |
| 2024 | 1703.7 | 5 | −14.2 |
| 2025 | 1509.8 | 17 | −193.9 |
Read the right-hand column and 2025 is not a bad year in a run of good ones; it is a different category of event. Nine straight seasons of drift, none of them moving the rating by as much as a hundred points in either direction, and then a move more than twice the size of the largest of them. The peak was 1782.7, reached on December 27, 2020 after a 17–14 win over Atlanta. The 2026 opening number is 274.5 points below that.
Some scale for 193.9. There are 829 season-over-season rating moves in this file; Kansas City's 2025 is the 20th steepest fall among them. Restrict to teams that started the year rated 1700 or better — 47 such team-seasons since 1999 — and only one has fallen further: the 2024 49ers, at −232.6. Third place is the 2002 Rams at −193.7, which the Chiefs clear by two tenths of a rating point. Falling this far from this high is close to unprecedented, and the model is not confused about how unusual it is; it is simply not built to discount it.
Where the 193.9 Went
Two components, and they are unequal. The model regresses every rating one third of the way toward 1505 between seasons, which took Kansas City from 1703.7 to 1637.5 before a snap was played — 66.2 points of pure offseason haircut. The other 127.7 was lost on the field.
And not evenly. The Chiefs were 5–3 through week 8 and the rating actually rose, topping out at 1672.1 after the week-8 win over Washington. Then 1–8 the rest of the way. The single worst night was week 16 at Tennessee, a 26–9 loss that cost 42.8 rating points in one evening — a heavy favorite losing badly to a team the model had thirty-second. Finish 6–11, and 1509.8 is what the arithmetic leaves.
Note what the engine was expecting while this happened. Summing its own pre-game probabilities across those seventeen games, the model expected 10.71 Kansas City wins in 2025. It got six. A 4.71-win miss on one team is roughly what a rating of that size is worth, and Elo's entire mechanism is to charge for exactly that.
The Uncomfortable Part: They Outscored Their Opponents
Here is the sentence that should make a reader suspicious of the board. Kansas City scored 362 points in 2025 and allowed 328. A 6–11 team with a positive point differential — twelfth-best in the league on that measure, while finishing in a three-way tie for 23rd by record and seventeenth on the ratings.
Run that differential through Pythagorean expectation at the site's standard exponent of 2.37 and 362-for-328 is worth 9.49 wins in seventeen games. The Chiefs won six. A 3.49-win shortfall is the second largest in 861 team-seasons in this file — only the 2020 Falcons, who went 4–12 on a Pythagorean 7.58, underperformed by more. The mechanism is no mystery: Kansas City played ten one-score games in 2025 and went 1–9 in them, while going 5–2 in the seven games decided by more than a score.
This site has already published, at length, what a one-score record is worth as a predictor: essentially nothing. Year-over-year, across 829 franchise pairs, one-score win percentage correlates at r = +0.08 (±0.04) against +0.40 (±0.03) for point margin per game — the bottom and the top of that page's persistence ladder. That page owns the persistence question and it named this exact matchup as its live test. So the tension is plain, and it belongs on this page in one sentence: the model docked Kansas City 193.9 rating points largely for a nine-loss run in coin-flip games that the site's own research says will not repeat.
Two honest qualifications, both of which matter. First, Elo is not a record model — it carries a margin-of-victory multiplier, so a three-point loss costs far less than a twenty-point one, and the 2025 fall would have been considerably steeper had those nine losses been blowouts. Second, the engine is not being defended on this one case: it is defended by its walk-forward backtest, 64.7% accuracy and a 0.2205 Brier over 4,363 games, which is what a model earns the right to be stubborn with. The correct reading is not "the rating is wrong." It is "the rating is a lagging measure with a known blind spot, and this is the season most likely to expose it."
Denver Is the Same Story, Pointed the Other Way
The symmetry is almost too neat. Denver went 14–3 in 2025 on a plus-90 differential, seventh in the league — five spots better than Kansas City on that measure, eight wins better in the standings. Its Pythagorean expectation was 10.99. The 3.01-win overshoot is the largest of any team in 2025, and it came from an 11–2 record in thirteen one-score games. The model expected 10.73 Denver wins and saw fourteen.
So in September 2025 this engine rated the two clubs within a twentieth of a win of each other — 10.71 expected for Kansas City, 10.73 for Denver. Twelve months later it separates them by 104.4 rating points, Denver fourth and Kansas City seventeenth, and the entire separation was manufactured in games decided by eight points or fewer. If close-game records are noise, the board has spent a year encoding noise. If they are not, the AFC West changed hands for real. There is no third option, and the file cannot yet tell you which.
For the division around them: the board reads Denver 1612.6 (4th), the Chargers 1530.9 (14th), Kansas City 1508.2 (17th), Las Vegas 1351.0 (31st) — a 261.6-point spread from top to bottom, second-widest of the eight divisions behind the NFC West's 280.2, and more than seven times the NFC North's 35.2. The AFC West's history, its reigns, and its brutal 2026 rest calendar belong to the division preview; this page is only about the price on one team.
Monday Night Is the Test
The schedule does not make anybody wait. Denver visits Arrowhead on Monday, September 14, week 1 — the biggest 2025 overperformer at the biggest underperformer, in the first week the ledger can grade. The math on the frozen row:
(1508.2 + 48) − 1612.6 = −56.4 → p(home) = 1 / (1 + 10^(56.4 / 400)) = 0.4195
The model picks Denver at 58.05%, in Kansas City, having granted the Chiefs the full home-field 48. The market does not agree in any respect: the bundled schedule file has Kansas City favored by 2.5 points, and its moneylines, de-vigged, make the Chiefs 58.30%. The two boards are 16.35 percentage points apart on a single game and do not even agree on who is favored — the second-largest disagreement of the sixteen openers, behind only Miami at Las Vegas. Those market numbers are the file's stored snapshot and they keep moving (a September 4, 2026 pull of the same public nflverse file already had Kansas City at −3); the model's 0.4195 cannot move, because it was frozen on August 12 and is graded as written. Today's companion study on road favorites covers what the history says about backing a traveler in general; this is the one game where the traveler is contested.
One more marker of how far the board has moved. Kansas City was the model's favorite in 36 consecutive home games, from November 21, 2021 against Dallas through the January 2025 conference championship against Buffalo. That run ended in week 2 of 2025, when Philadelphia arrived and the number came out at .4603; Detroit in week 6 (.4907) and Denver in week 17 (.4372) made three home-underdog games in one season, after none in the previous three. Monday will be the fourth since last September. Before 2025, the last one was Green Bay in November 2021 — the model spent 2022, 2023 and 2024 without ever making Kansas City a home underdog.
What the Rating Is Not Claiming
- It knows nothing about the roster. No injuries, no departures, no quarterback. The engine reads scores and dates, and it does not know whether the team that lost nine one-score games in 2025 is the team that will play in 2026. Every roster question this page raises is a question the model is structurally unable to answer.
- Seventeenth is a price, not a prediction of seventeenth. The ledger's simulation gives Kansas City 8.37 expected wins and a 38% playoff probability as of August 20 — a coin-flip team in a hard division, not a bad one. There is a wide distribution behind that.
- The Pythagorean comparison is a description, not a forecast. Points scored and allowed are more stable than close-game records, but the 2025 differential is one season of evidence and includes its own noise. It says the record understated the team; it does not say by how much 2026 will correct.
- One season is one season, on both sides. The Denver mirror is exactly as thin as the Kansas City case. Nothing here argues Denver is a fraud; it argues that two teams' ratings currently rest on the same fragile foundation, in opposite directions.
- The schedule is not the excuse either. By the board's own ratings, Kansas City's 2026 opponents average 1510.7, the 14th-hardest slate of 32. This is a middle calendar. Whatever happens will not be the schedule's doing.
- Nothing here has been graded. No 2026 game has been played. Every 2026 number on this page is a frozen forecast or a schedule fact, and the ledger will attach results without editing the probabilities.
Reproduce It
Two public files: games.csv from nflverse nfldata, bundled at /data/games.csv, and this site's frozen ledger at /data/predictions.json. The rating path is not re-implemented for this page — the script imports the ledger's own engine and replays it, then checks the final number against what was published:
import nfl_elo as E          # K=20, HFA=48, base 1505, 1/3 preseason regression

rows, eng, path = E.load_games(), E.Engine(), []
for r in rows:
    if not E.played(r):
        continue
    h, a = E.canon(r["home_team"]), E.canon(r["away_team"])
    eng.predict(r); eng.feed(r)
    if "KC" in (h, a):
        path.append((r["gameday"], eng.rating("KC")))

end_2025 = path[-1][1]                                   # 1509.8
carried  = end_2025 * 2 / 3 + 1505 / 3                   # 1508.2 = the published row
Everything above — the rank history, the 193.9 and its 66.2 / 127.7 split, the 1782.7 peak and its date, the 20th-of-829 and second-of-47 placements, the 2025 record and splits, the Pythagorean table across all 861 team-seasons, Denver's mirror, the 36-game home-favorite run, the opener's arithmetic and the de-vigged market price — is recomputed and asserted by explainer_src/make_kc_rating_chart.py: 119 assertions, all green as of September 4, 2026.
Further reading
- The Road Favorite Discount That Isn't There — today's companion: what 6,871 games say about backing a traveler
- One-Score Records Are Luck — the persistence test this page leans on, and the study that named this game as its own live test
- Pythagorean Wins — the formula and exponent behind the 9.49
- The Prediction Model — how the rating updates, and the backtest that earns it the benefit of the doubt
- Kansas City team page — the 2026 slate, the 2025 ledger, and the franchise record, all computed at build
- 2026 Playoff Odds — where 1508.2 lands in 20,000 simulated seasons
- AFC West 2026 — nine reigns, one handover, and the league's meanest rest calendar
- Power Rankings and the prediction ledger — the live board, and where Monday gets graded
- Data: the nflverse games file bundled at
/data/games.csv; franchise continuity maps SD to LAC, STL to LA and OAK to LV throughout.
Go deeper
Want the code behind these metrics? Work through the 43-chapter NFL analytics tutorial.
Browse tutorials Free tools