The Finding: .500 Is Functionally Extinct
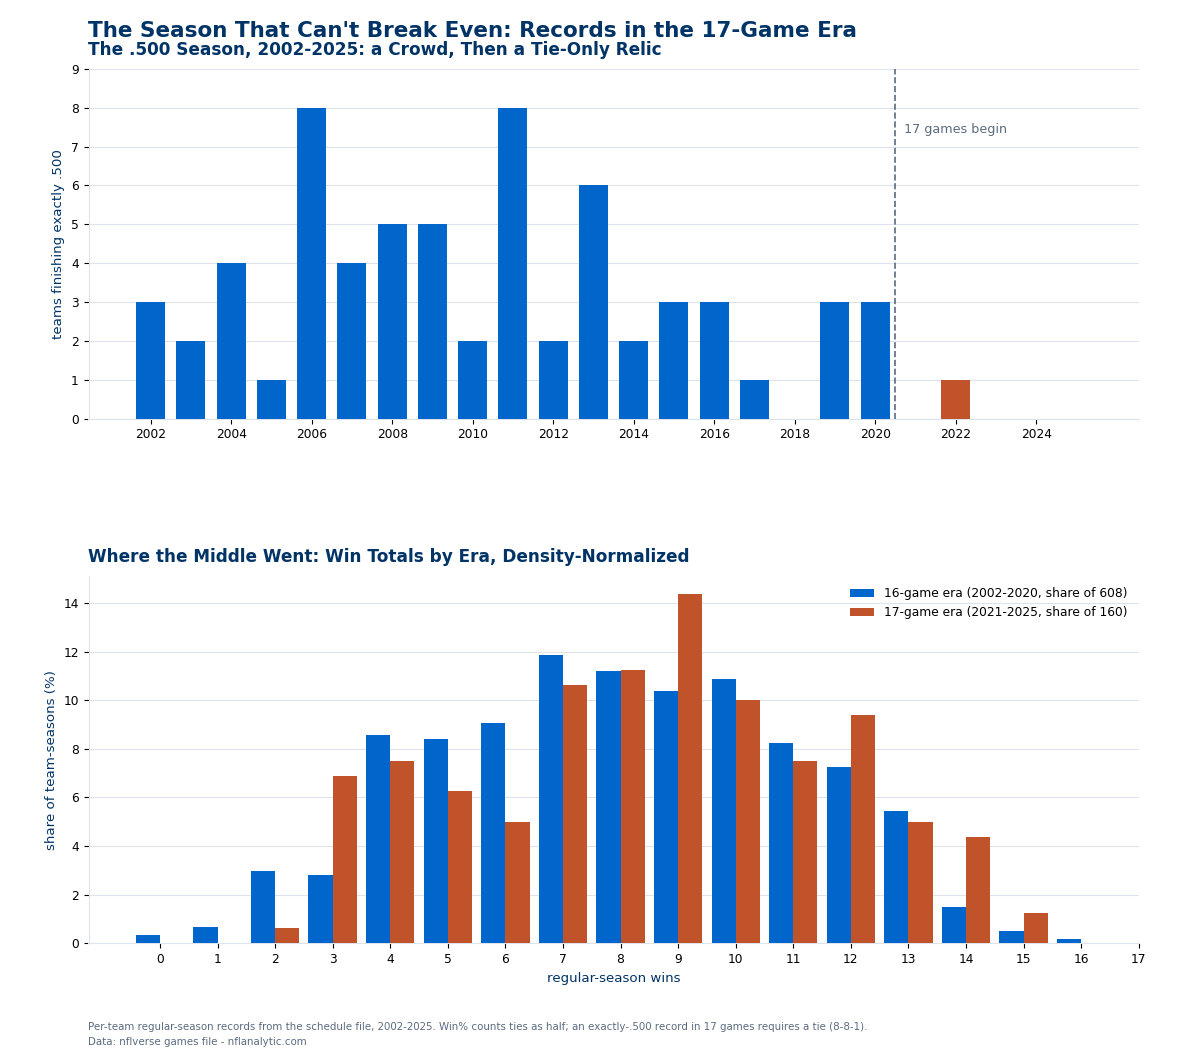
For nineteen seasons under the 16-game schedule, finishing exactly even was one of football's most ordinary outcomes. From 2002 through 2020 the league produced 65 team-seasons at exactly .500 — every one of them a plain 8-8 — about 3.4 a year. The seventeenth game, added in 2021, deleted that outcome from the arithmetic: with an odd number of games you cannot split them evenly, so a .500 season now requires a tie. Five seasons and 160 team-seasons into the era, it has happened exactly once: Washington's 8-8-1 in 2022, which needed a 20-20 draw against the Giants to land on the number, and still missed the playoffs.
The Exhibit: Where the Middle Went
| Record fact | 16-game era (2002–2020) | 17-game era (2021–2025) |
|---|---|---|
| Exactly .500 team-seasons | 65 of 608 (all 8-8) | 1 of 160 (8-8-1, tie required) |
| Within one game of even | 8-8: 3.4/season | 8-9 + 9-8: 7.4/season |
| Most common win total | 7 (11.8% of team-seasons) | 9 (14.4%) |
| Win% ≥ .750 | 14.8% | 11.3% |
| Win% ≤ .250 | 14.8% | 14.4% |
Win% counts ties as half. 608 and 160 team-seasons; the cancelled 2022 Buffalo–Cincinnati game (below) leaves both clubs at 16 games that year.
The Twin Peaks That Replaced 8-8
Mediocrity did not go away; it just lost its name. The era has produced 37 team-seasons within one game of even — 17 clubs at 8-9, 20 at 9-8 — which is a bigger crowd per season than the old 8-8 block ever drew. What changed is the label each half wears. A 9-8 team gets to call itself a winning team, and since 2021 nine of the 23 clubs that won exactly nine games made the playoffs (39%); an 8-9 team is a losing team at a win% of .471, two and a half points below the 8-8 club it would have been in the old schedule. The seventeenth game functions as a league-wide tiebreaker against the record itself: everyone who would have been even gets sorted, by one Sunday, into winners and losers.
The middle of the whole distribution moved with it. In the 16-game era the most common season was seven wins (11.8% of team-seasons), with eight right behind; in the 17-game era it is nine wins (14.4%). Nothing about the league's talent changed — the average team still wins half its games by construction. The extra half-win of schedule just relocated the peak.
Nine Home Games or Eight: the League's Built-In Coin Flip
The odd schedule has a second, stranger consequence: home dates no longer split evenly. Every season, one conference's sixteen clubs are designated home in nine games and the other's in eight, alternating — AFC in 2021, 2023 and 2025, NFC in 2022 and 2024, and NFC again in 2026, where all sixteen seventeenth-games are NFC-hosted. On paper the ninth home date is worth about +0.5 percentage points of season win rate — swap one road game for a home game in an era where home teams win 54.1% of decided games, spread it over 17 — and the measured gap runs bigger: the nine-home cohort has hit .509 to the eight-home cohort's .484, +2.5 points.
Resist the urge to call that an effect. The league assigns the ninth home game by conference, so the comparison is really five observations, not 158: whichever conference was better that year drags its whole cohort with it. The 2023 gap is mostly the AFC winning the interconference year 46–34 while holding nine home dates; 2024 is the NFC doing the same at 47–33. The AFC–NFC ledger shows those two swings cancel to nearly nothing, which is why the honest read is: the arithmetic says half a point, the sample is five coin flips, and the design of the schedule makes the question genuinely unanswerable from record data alone. The exhibit's fine print also notes that the paper count and the real count differ: the international slate has shaved a designated home date off 26 team-seasons since 2021 without giving anyone a true home game back.
The Game That Never Happened
One asterisk sits in the era's ledger and deserves its own paragraph rather than a footnote. Week 17 of 2022, Buffalo at Cincinnati was stopped in the first quarter after Damar Hamlin's cardiac arrest and was never made up: the schedule file simply has no completed row for it, and both clubs' 2022 seasons are 16 games long — the era's only two. Every computation on this page handles them explicitly (they are excluded from the nine-home/eight-home cohorts, since the cancellation cost Cincinnati a home designation), and the assertion suite pins them at 16 games so the exception can never silently spread.
Translating Records Across the Era
Every argument that reaches across 2021 — "worst team since", "first club to start 0-2 and win 12" — now crosses a unit change, and most of them don't notice. The honest conversion is win percentage, and the whole-game grid makes some translations impossible: the old 10-6 benchmark (.625) is 10.625 wins over 17, a record no club can post — 11-6 (.647) clears the old bar, 10-7 (.588) falls short of it. The old 12-4 (.750) maps to 12.75: you need 13-4. That rising rounding bar is most of why the ≥.750 tail thinned from 14.8% of team-seasons to 11.3%. Meanwhile ten wins quietly appreciated: exactly-10-win clubs made the playoffs 84.8% of the time in the 16-game era and are 15-for-16 (93.8%) since — though be careful crediting the schedule alone, because the playoff field also grew to fourteen teams in 2020, and this page cannot split those two causes with five seasons of data.
What This Page Can and Cannot Tell You
Five seasons is a short era. The win-distribution comparison mixes the schedule change with everything else that drifted since 2021 — rosters, rules, kickoff mechanics — and this page makes no claim to have isolated the seventeenth game's causal share of anything except the arithmetic, which needs no isolating: .500 requires a tie now, and ties are rarer still — four in the era's five seasons (the overtime page covers why they happen at all); 10-6 is unpostable; and one conference gets sixteen extra home dates a year. The nine-home cohort gap is reported with its confound attached, not as a discovery. Every number above is recomputed and asserted on each build by explainer_src/make_17_game_chart.py — 29 assertions, including the 608/160 cohort counts, the tie-required check on every 17-era .500 season, the conference purity of each season's nine-home cohort, and the Buffalo–Cincinnati exception — so if the schedule file changes, this page fails loudly rather than aging quietly into fiction.
Further reading
- Chapter 26: Schedule and Rest Analysis, DataField.dev.
- Schedule and results: the nflverse games file bundled at
/data/games.csv. - The Series Nobody Tracks: AFC vs NFC — the ledger that explains the nine-home cohort's gap
- 2026 Schedule Quirks — the rest ledger: byes, short weeks and who controls December
- 2026 Win Totals — where the 8.5-win average actually lands, club by club
- 2026 International Games — the home dates that exist on paper only
- Overtime — why ties still happen at all
Go deeper
Want the code behind these metrics? Work through the 43-chapter NFL analytics tutorial.
Browse tutorials Free tools