Three Bets, Three Sample Sizes
Detroit, Dallas and New England enter 2026 having made the same wager — that the man on the sideline is the right man — on wildly different amounts of evidence. Dan Campbell has coached 89 games for the Lions, the fullest coaching ledger of the three, and it just acquired its first dent. Mike Vrabel has 125 games across two franchises, and they contain two different stories about the same coach. Brian Schottenheimer has 17. This page puts all three ledgers on one scale — regular-season point differential, season by season, against what each coach inherited — and then reads them beside what the site's own ratings expect from 2026. The schedule file this site bundles records the head coach of every game, so every record below is computed from the games each man actually coached, not inferred from franchise history.
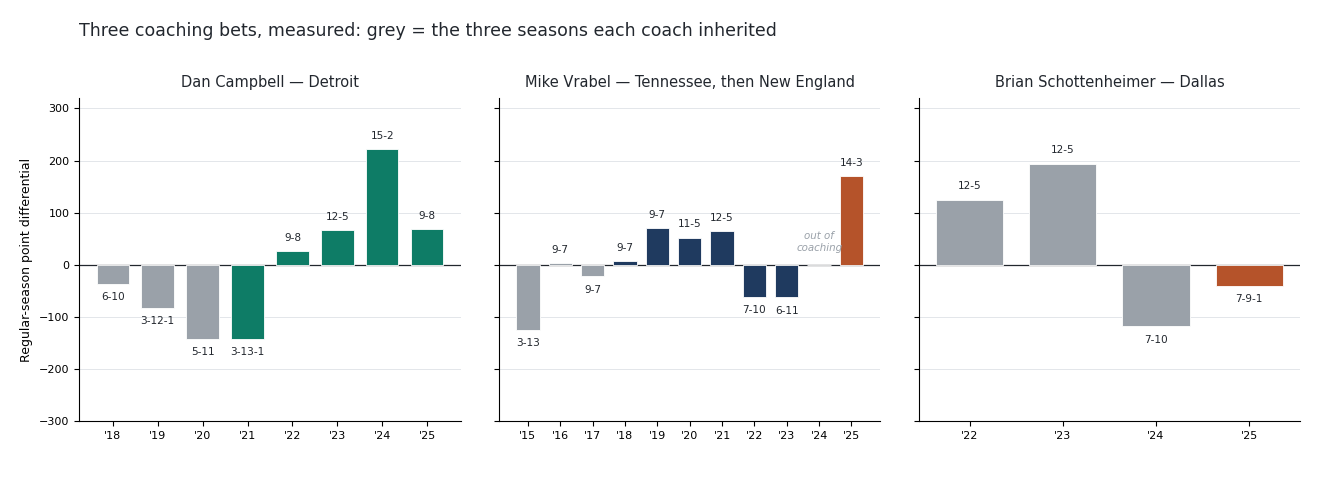
The Exhibit: What Each Man Was Handed, and What He Did
| Coach | Career REG | Point diff | Playoffs | One-score | Blowouts (≥17) |
|---|---|---|---|---|---|
| Dan Campbell (DET, 2021–) | 48-36-1 | +240 | 2-2 | 21-21-1 | 14-8 |
| Mike Vrabel (TEN 2018–23, NE 2025–) | 68-48 | +242 | 5-4 | 37-26 | 22-12 |
| Brian Schottenheimer (DAL, 2025–) | 7-9-1 | −40 | — | 4-3-1 | 2-4 |
Computed from the coached games only. One-score = final margin of eight or fewer; playoff ledgers include every postseason round. Campbell and Vrabel arrive at nearly identical career differentials (+240 and +242) by opposite routes — five seasons in one building versus eight across two.
Detroit: 89 Games of Proof, One Fresh Dent
The Campbell bet is the most documented coaching wager in football. He took over a roster that had produced 14 wins in three years at a combined −260, went 3-13-1 himself, and then built in public: +26, +66, and the +222 of 15-2 in 2024 — the best Lions season in the Super Bowl era by differential in this file. Then 2025 happened: 9-8, +68, no playoffs. Read the bar, not the headline — a +68 season is a good team having an ordinary year, and it out-pointed both 9-8 rivals in its own division. But the slip was real, and it had a mechanism you can name: the staff that built the 2023–24 peak left to run other teams. Ben Johnson, offensive coordinator for the 36-15 stretch of 2022–24, became head coach of the Bears — and won this division at 11-6, over his old boss, in year one. Defensive coordinator Aaron Glenn left the same winter to run the Jets. The 2025 offense ran under one-year coordinator John Morton; for 2026 Campbell hired Drew Petzing away from Arizona, his second play-caller in two seasons (team announcement).
The identity survived the exodus. Detroit under Campbell remains the league's signature fourth-down team — Sports Info Solutions' October 2025 review counted a league-leading 182 attempts and 102 conversions since 2021, the aggression ESPN chronicled as the "Dan Gamble" tradition. What the aggression buys shows up in a specific place in the table above: Campbell's teams are 14-8 in blowouts and exactly .500 (21-21-1) in one-score games. The style piles on points when it works and hands the close ones to variance — which is not a criticism, just the shape of the bet.
The model buys the bounce-back. Detroit opens 2026 at 1563.9, ninth on the power-rankings board, with an expected 10.24 wins against a market line of 9.93 — one of the few teams the frozen ratings like better than the market — and a 70.0% playoff probability on the simulated season. The quiet reason: the schedule page ranks Detroit's slate 27th of 32 in opponent strength (.467). A 9-8 team with a +68 differential and the league's fourth-easiest schedule is what a bounce-back looks like before it happens.
New England: the Pattern That Cuts Both Ways
Vrabel's ledger is the strangest of the three because it contains a complete career arc — rise, decline, exile, resurrection — and 2026 has to decide which part was signal. Tennessee 2018–21: four straight winning seasons (9-7, 9-7, 11-5, 12-5), a 5-4 playoff record. Tennessee 2022–23: 13-21 at −123, and he was out of football entirely in 2024 — the chart leaves the year blank because the record does. Then New England, which had gone 16-35 at −241 over three post-Belichick-era seasons, hired him in January 2025 (the franchise's 16th head coach), and he delivered the fastest turnaround in this dataset's coach records: 4-13 to 14-3, a ten-win jump on a +298 differential swing, then a playoff run of 16-3 over the Chargers, 28-16 over Houston, and a 10-7 road win at Denver for the conference title — before Seattle ended it 29-13 in the Super Bowl.
Note the close-game column: Vrabel's career one-score record is 37-26 (.587), well above the .500 that one-score games pay out league-wide in the long run. Some of that is skill expressed in game management; the honest reading is that some of it is also on loan from variance, and the Tennessee decline shows what the same coach looks like when the loans get called. The 2026 schedule will interrogate the resurrection properly: the sixth-hardest slate in football (.531), a market win total of 10.60 that sits above the model's 10.12 — the ratings are half a win cooler on the repeat than the public — a 72.1% playoff probability, and an opening assignment with no warm-up: week 1 at Seattle, September 9, at the stadium of the team that beat them in February, currently rated 1674.6, first on the board by 59 points. The rematch is the season's very first data point.
Dallas: a Promissory Note, Cosigned by the Owner
Schottenheimer's ledger is seventeen games long, which is to say it is barely a ledger. Promoted from coordinator in January 2025 as the tenth head coach in franchise history, he inherited a strange baseline: 12-5 twice in 2022–23, then the 7-10, −118 collapse of 2024. His first season split the difference in the least satisfying way — 7-9-1, half a win worse, 78 points of differential better (−118 to −40). Both things are true: the team was more competitive and the record didn't show it. At 2-4 in blowouts and 4-3-1 in one-score games, the sample contains almost no leverage — flip one bounce in the tie and the season reads differently. Seventeen games settle nothing; that is arithmetic, not charity.
The model, which grades bodies of work and not press conferences, is unmoved: 1460.7, 22nd on the board, 7.33 expected wins against a market 7.42 (the two agree on Dallas to within a tenth — nobody is arguing), a 19.8% playoff probability and 10.0% in a division the model prices as winnable by three teams. The 2026 season is the actual bet: year two, a middle schedule (20th, .493), and expectations that have outrun the evidence. What would count as evidence by December: a positive differential, a close-game record that doesn't have to carry the story, and the NFC East games — the schedule grants Dallas its proof or its verdict either way.
Worked Example: What a Close-Game Reputation Is Actually Worth
The table's one-score column looks decisive — Vrabel .587, Campbell .500 — so price it. A team plays about eight or nine one-score games a season (Campbell's Lions have averaged 8.6, Vrabel's teams 7.9, in the coached games above). Take nine. The gap between converting them at .587 and at .500 is 9 × 0.087 = 0.78 — about three-quarters of a win per season, before regression eats its share. Meanwhile the differential column is what actually separates these teams on the board: Detroit and Dallas sit 103 rating points apart today, a gap the rating system built out of years of final scores, not close-game folklore. The close-game reputation is the story everyone tells; the differential is the thing the ratings pay. That ordering is why New England opens sixth and not first, and why Detroit's 9-8 outranks Dallas's 7-9-1 by thirteen places.
What a Coach Ledger Cannot Tell You
Four honest caveats. First, a coach's record is not a coach's effect — these ledgers conflate the man with his quarterbacks, his general managers, his coordinators and his injury luck; Campbell's dent arrived the same winter his two coordinators left, and untangling those is beyond any schedule file. Second, inheritance baselines are context, not causation — teams that just went 4-13 tend to improve under anyone, which is precisely why the +298 swing is graded against that gravity and still stands out. Third, seventeen games is a coin-flip-sized sample — everything said about Dallas above is provisional by construction. Fourth, the model whose 2026 numbers anchor each section knows none of this: Elo sees final scores, not sidelines, and prices Campbell's exodus, Vrabel's exile and Schottenheimer's promotion at exactly zero. That blindness is the point of reading them together — where the sideline story and the ratings disagree, one of them will be wrong on the record by January.
Every number above is recomputed and asserted on each build by explainer_src/make_coach_ledger_chart.py — 55 assertions, from the per-season tenure lines and both career differentials down to the 2025 NFC North table, New England's four playoff scores, all three week-1 assignments, and the live ratings for all three teams plus Seattle — so if the schedule file or the ratings move, this page fails loudly rather than aging quietly. As of August 31, 2026.
Further reading
- The power rankings — where all three teams sit on the Elo board this week, movement tracked all season
- Detroit, Dallas and New England team pages — schedules, 2025 ledgers, and season desks that grade every 2026 game
- Elo-Implied 2026 Win Totals and Playoff Odds — the season each roster is priced for
- 2026 Strength of Schedule — Detroit's 27th-ranked slate and New England's 6th, quantified
- The NFC North preview and AFC East preview — the divisions these bets play out in
- One-Score Games and Close-Game Luck — why the .587 doesn't fully belong to anybody
- Coach verification: detroitlions.com, dallascowboys.com, patriots.com, with hire dates and 2025 season facts cross-checked against ESPN and the Wikipedia season pages; fourth-down figures per Sports Info Solutions (Oct 2025) and ESPN.
- Schedule and results: the nflverse games file bundled at
/data/games.csv(per-game coach fields); ratings in/data/predictions.json.
Go deeper
Want the code behind these metrics? Work through the 43-chapter NFL analytics tutorial.
Browse tutorials Free tools