A Wednesday, a Grudge, and the Widest Gap on the Board
The 2026 season opens on a Wednesday night — September 9, 8:20 Eastern, Lumen Field — and it opens with a grudge. New England at Seattle is the first game in the schedule file, and it is a Super Bowl rematch: seven months and a day after the Seahawks took Super Bowl LX from the Patriots 29–13, the league hands the champion its banner night against the team it beat. This page is the deep read on that one game — the series behind it, the number the model froze on it in August, and the parts of the story a rating system is honest enough to admit it cannot see.
The calendar itself is a collector's item. In the twenty-eight seasons this site's data file covers, exactly one other regular-season week-1 game was played on a Wednesday: Cowboys at Giants, September 5, 2012 — another champion's banner night, and the road team spoiled it, 24–17. That is the entire historical sample of Wednesday openers, and the visitor is 1–0 in it. The full census of 2026's calendar oddities lives in the schedule quirks page; this one borrows only its strangest line.
Eight Meetings, Six of Them One-Score
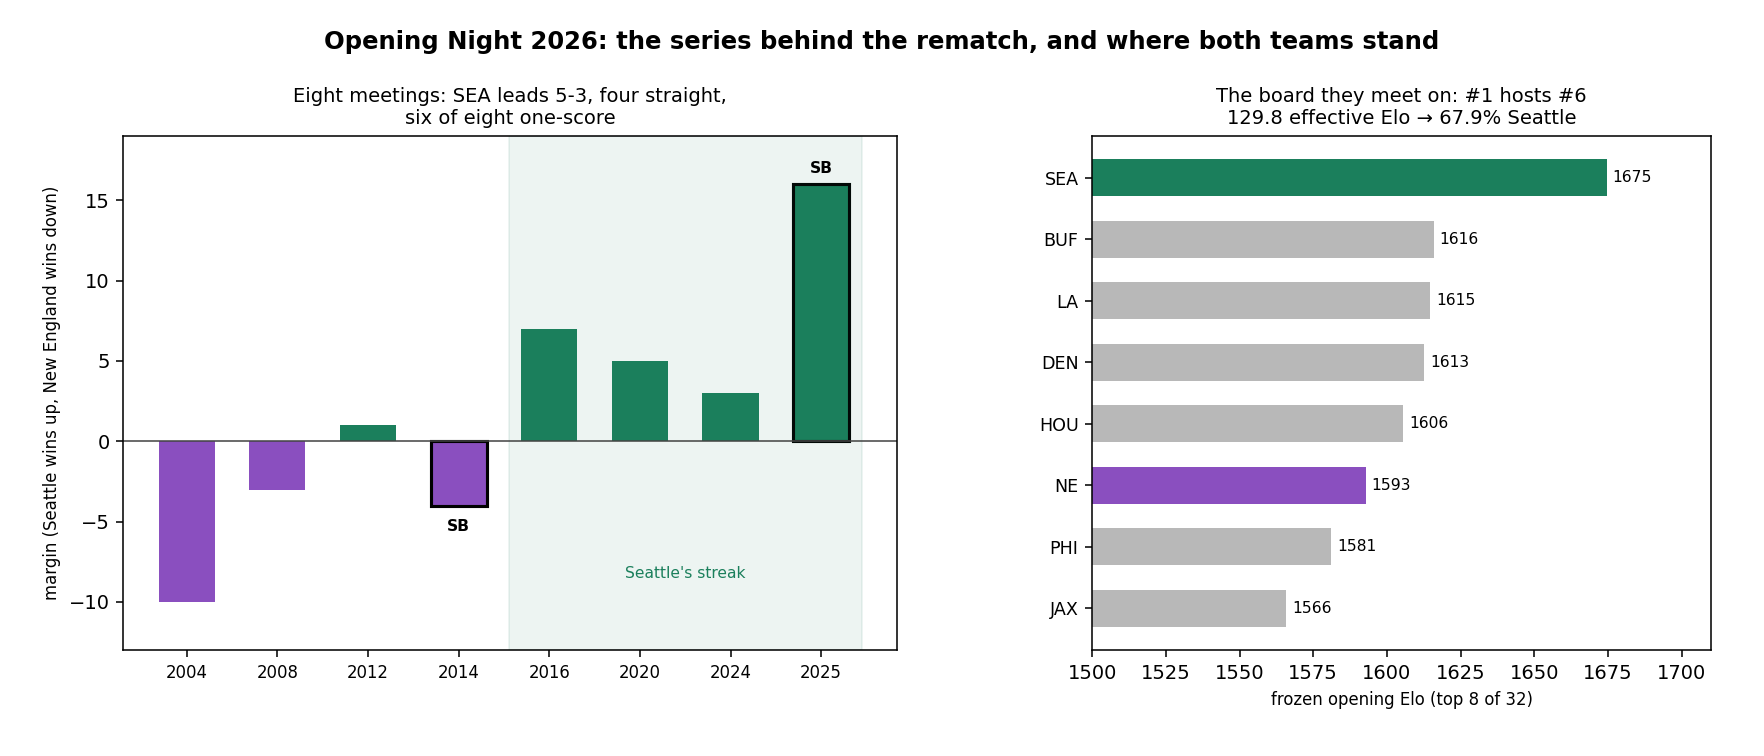
These two franchises have met eight times in the file, and the series has a personality: it is close, it is strange, and lately it belongs to Seattle. The ledger reads Seattle 5, New England 3, and before February's 16-point Super Bowl the seven previous meetings had been decided by an average of 4.7 points. Six of the eight finished one-score. This series does not do blowouts — it did its first one in February, on the biggest stage the sport has.
| Season | Game | Result | Margin |
|---|---|---|---|
| 2004 | SEA at NE | Patriots 30–20 | 10 |
| 2008 | NE at SEA | Patriots 24–21 | 3 |
| 2012 | NE at SEA | Seahawks 24–23 | 1 |
| 2014 | Super Bowl XLIX | Patriots 28–24 | 4 |
| 2016 | SEA at NE | Seahawks 31–24 | 7 |
| 2020 | NE at SEA | Seahawks 35–30 | 5 |
| 2024 | SEA at NE | Seahawks 23–20 | 3 |
| 2025 | Super Bowl LX | Seahawks 29–13 | 16 |
Three details worth carrying into Wednesday. First, Seattle has won four straight in the series — 2016, 2020, 2024, and the Super Bowl. The last time New England beat Seattle was February 1, 2015: Super Bowl XLIX, the goal-line interception game, 28–24. Every Patriots fan knows this series has already staged one championship heist in each direction. Second, New England's three regular-season trips to Seattle produced margins of 3, 1 and 5 — a 1–2 record, every game in doubt at the two-minute warning. Third, the 2024 meeting was in Foxborough and Seattle still won it by 3, in week 2 of Vrabel's predecessor's final season — the one recent data point from before either team was what it is now.
The Model's Line: 129.8 Points of Elo, 67.9%
The ledger froze its opening ratings on August 12 and has not moved them since — that is the design. Seattle enters at 1674.6, first of thirty-two and 58.7 points clear of second-place Buffalo — the only team in the power rankings' top tier. New England enters at 1592.8, sixth — the fastest riser of 2025, but a full class below the champion. Add the standard +48 home edge for Lumen Field and the effective gap is 129.8 points of Elo, which the house formula converts to 67.9% Seattle (0.6785 — the exact number sitting in the week-1 board, where this game is priced alongside the other fifteen). For scale: a 130-point gap is the widest of the opening week's marquee games, and Seattle's Elo-implied win total of 12.2 is the league's highest.
A worked check on that probability, since this site shows its arithmetic: 1674.6 + 48 − 1592.8 = 129.8, and 1 / (1 + 10−129.8/400) = 0.679. Two-in-three, roughly — the model considers a Patriots win entirely ordinary, a one-in-three event. If it happens, the ledger takes the miss in public and moves the ratings; the miss budget already set aside 6.09 expected wrong picks for the opening week, and this game contributes 0.32 of them.
What the Number Refuses to Know
The rating system prices exactly two things: results and venue. It does not know that Mike Vrabel spent February watching Seattle celebrate on his field — the sharpest sting available to a man whose first New England season was a +298-point turnaround that ended one game short. It does not know this is a revenge game, because revenge is not a column in the file. Whether it should be a column is an empirical question, and this site checked: the Super Bowl rematch effect, published today as this page's companion, finds six next-season sequels since 1999 — and the avenger won exactly one of them. The champion won the other five by an average of a touchdown. History's advice to the grudge-holder is not encouraging, though six games of history should be held loosely.
The number also cannot see rosters, August injuries, or scheme — it is deliberately blind to everything except what teams have done in games that counted. That blindness is the point: when Wednesday's result grades, it will move the rating by exactly what the result earns and nothing else. The New England and Seattle season desks will grade this game within a day of the final whistle, and the power rankings will show the season's first real movement Thursday morning.
Verification and Limits
Every number on this page — all eight series results, the margins and the streak, the 2012 Wednesday precedent, the ratings, the 129.8-point gap and the 0.6785 — is recomputed from /data/games.csv and /data/predictions.json by explainer_src/make_opening_night_chart.py: 52 assertions, run at every build, so the page fails loudly if the data moves under it. The limits are the honest ones: this is one game, and 67.9% loses one time in three; the series history is eight games across two decades of entirely different rosters; and the Wednesday-opener sample is a single 2012 anecdote, cited as trivia, not signal. As of September 3, 2026.
Further reading
- The Super Bowl Rematch Effect — today's companion piece: six sequels since 1999, and what happened to every champion and every avenger
- Week 1 Predictions, By the Numbers — this game priced alongside the other fifteen, with the full upset distribution
- The Coach Ledger — Vrabel's 4–13 to 14–3 arc, measured against what he inherited
- The Power Rankings — Seattle alone in tier one, 59 points clear; movement starts when this game grades
- 2026 Schedule Quirks — the Wednesday opener in its full calendar context
- The Miss Budget — the 99 wrong picks this model expects to take in public this season, starting Wednesday
- Data: the nflverse games file bundled at
/data/games.csv; frozen ratings in/data/predictions.json(locked 2026-08-12).
Go deeper
Want the code behind these metrics? Work through the 43-chapter NFL analytics tutorial.
Browse tutorials Free tools