Sixteen Numbers, Locked Before Anyone Kicked Anything
The prediction ledger froze its opening ratings on August 12 and priced every week-1 game then and there: a win probability for each of the 16 openers, locked before a single snap of consequence, graded in public as the finals arrive. This page is the pre-kickoff walkthrough of those 16 numbers — where each one comes from, what they add up to, and exactly how wrong the model expects to be by Monday night. Dated August 31, 2026, and deliberately never edited afterward: the point of freezing a number is that it stays frozen.
The Board, Decomposed
Every number below is the same arithmetic: take both teams' frozen Elo, give the home side its +48 — except in Melbourne, where the ledger waives it — and convert the gap with the logistic curve. No game-by-game judgment calls, no adjusting for vibes. The 2025 records are from the schedule file, and they are context, not inputs: the ratings already digested those seasons, then regressed a third of the way to the mean.
| Day | Game | Away Elo | Home Elo | Home edge | Home win % | Model pick | 2025 records |
|---|---|---|---|---|---|---|---|
| Wed | NE at SEA | 1592.8 | 1674.6 | +48 | 67.9% | SEA | 14-3 / 14-3 |
| Thu | SF at LA (Melbourne) | 1559.4 | 1614.7 | waived | 57.9% | LA | 12-5 / 12-5 |
| Sun | ATL at PIT | 1470.3 | 1516.0 | +48 | 63.2% | PIT | 8-9 / 10-7 |
| Sun | BAL at IND | 1553.4 | 1469.4 | +48 | 44.8% | BAL | 8-9 / 8-9 |
| Sun | BUF at HOU | 1615.9 | 1605.6 | +48 | 55.4% | HOU ◆ | 12-5 / 12-5 |
| Sun | CHI at CAR | 1528.7 | 1426.3 | +48 | 42.2% | CHI | 11-6 / 8-9 |
| Sun | CLE at JAX | 1419.9 | 1565.9 | +48 | 75.3% | JAX | 5-12 / 13-4 |
| Sun | NO at DET | 1435.3 | 1563.9 | +48 | 73.4% | DET | 6-11 / 9-8 |
| Sun | NYJ at TEN | 1361.5 | 1349.8 | +48 | 55.2% | TEN | 3-14 / 3-14 |
| Sun | TB at CIN | 1488.4 | 1480.4 | +48 | 55.7% | CIN | 8-9 / 6-11 |
| Sun | ARI at LAC | 1394.4 | 1530.9 | +48 | 74.3% | LAC | 3-14 / 11-6 |
| Sun | GB at MIN | 1535.9 | 1556.1 | +48 | 59.7% | MIN ◆ | 9-7-1 / 9-8 |
| Sun | MIA at LV | 1459.1 | 1351.0 | +48 | 41.4% | MIA ◆ | 7-10 / 3-14 |
| Sun | WAS at PHI | 1458.2 | 1581.2 | +48 | 72.8% | PHI | 5-12 / 11-6 |
| Sun | DAL at NYG | 1460.7 | 1419.3 | +48 | 51.0% | NYG ◆ | 7-9-1 / 4-13 |
| Mon | DEN at KC | 1612.6 | 1508.2 | +48 | 42.0% | DEN ◆ | 14-3 / 6-11 |
Bold = road favorite (four of them). ◆ = the model's winner differs from the schedule file's market snapshot. Melbourne's home edge is waived because nobody is home in Melbourne.
A few rows deserve their sentence. The Wednesday opener is the Super Bowl rematch — the slate page covers why it is a Wednesday — and the model prices it as the week's fifth-biggest edge: the No. 1 team on the board, at home, against No. 6, two 14-3 teams the ratings nonetheless separate by 82 points. Jets at Titans is the only game played entirely inside the bottom rankings tier, No. 30 visiting No. 32, both coming off identical 3-14 seasons and separated by 11.7 rating points — the closest thing the schedule offers to a controlled experiment in home field. And three pairings arrive with mirrored 2025 records — 14-3 against 14-3, 12-5 against 12-5 twice — which the ratings cheerfully ignore, because a record and a rating are not the same claim about a team.
One Row, Worked End to End
Take the opener. Seattle's frozen rating is 1674.6; New England's is 1592.8. Seattle is home, so it gets the +48: an effective gap of 1674.6 + 48 − 1592.8 = 129.8 points. The house curve turns a gap into a probability: p = 1 / (1 + 10−129.8/400) = 1 / (1 + 0.4736) = 0.6785. That is the ledger's 67.9% — not an opinion about the rematch, just the frozen distance between two numbers, pushed through a logistic. Every other row is the same arithmetic; this page's build script re-derives all 16 from the published ratings and refuses to render if any differs from the ledger by more than rounding.
Five Quarrels With the Market, All of Them Small
The schedule file carries a market snapshot for every opener — the slate page quotes the lines themselves — and in eleven games the file's favorite and the model's favorite are the same team. The other five are the interesting ones, and they share a shape: every disagreement lives inside three market points. The model never quarrels with the market about a big favorite; it quarrels about coin flips.
- Buffalo at Houston — the file has Buffalo by 1.5; the model says Houston, 55.4%. Buffalo's rating is 10.3 points higher, but ratings don't travel: +48 flips it.
- Green Bay at Minnesota — the file has Green Bay by 1.5; the model says Minnesota, 59.7%, for the same reason with a bigger cushion.
- Dallas at the Giants — the file has Dallas by 1.5; the model says the Giants by the skin of the formula, 51.0%. A 41.4-point Dallas edge against a 48-point home edge leaves 6.6 points of nothing.
- Miami at Las Vegas — the file has the Raiders by 3; the model says Miami, 58.6%, mostly because it still believes very little about a 3-14 team's rating.
- Denver at Kansas City — the file has Kansas City by 2.5; the model says Denver, 58.1%. This is the week-1 installment of the frozen board's coldest position — the playoff-odds page already put Kansas City at 38% to make the field — and Monday night is the first time it gets graded.
Both sides of each quarrel are on the record before kickoff: the market's number sits in the schedule file, ours sits in the ledger. The honest caveat is that they are not measuring the same thing — the frozen ratings digest results through last February and then regress; the market prices this September's actual rosters. When these five games resolve, they resolve a question about this model's blindness to offseasons, not about who is smarter in general. That is still a question worth grading.
The Upset Budget, Opening-Week Edition
Sum the favorites' probabilities and the board expects 9.91 favorite wins — equivalently, 6.09 upsets, the number the miss budget already published as week 1's share of the season's 99. But an expectation hides the shape, so the build script computes the exact distribution — a Poisson-binomial over each game's underdog probability, no bell-curve approximation:
- The single most likely week is 6 upsets (20.5%), with the median also at 6.
- A quiet week — three upsets or fewer — has probability 8.5%. If Monday night ends with chalk mostly intact, that was a top-decile weekend for the favorites, not a normal one.
- A loud week — eight or more — comes in at 22.8%, nearly three times as likely as the quiet one, because this board is built out of modest edges: eleven of the 16 favorites sit under 64%.
- All sixteen favorites winning is a 0.04% event — once in roughly 2,400 opening weeks. Somebody on this board loses who "shouldn't." The model just doesn't know who, and says so with arithmetic.
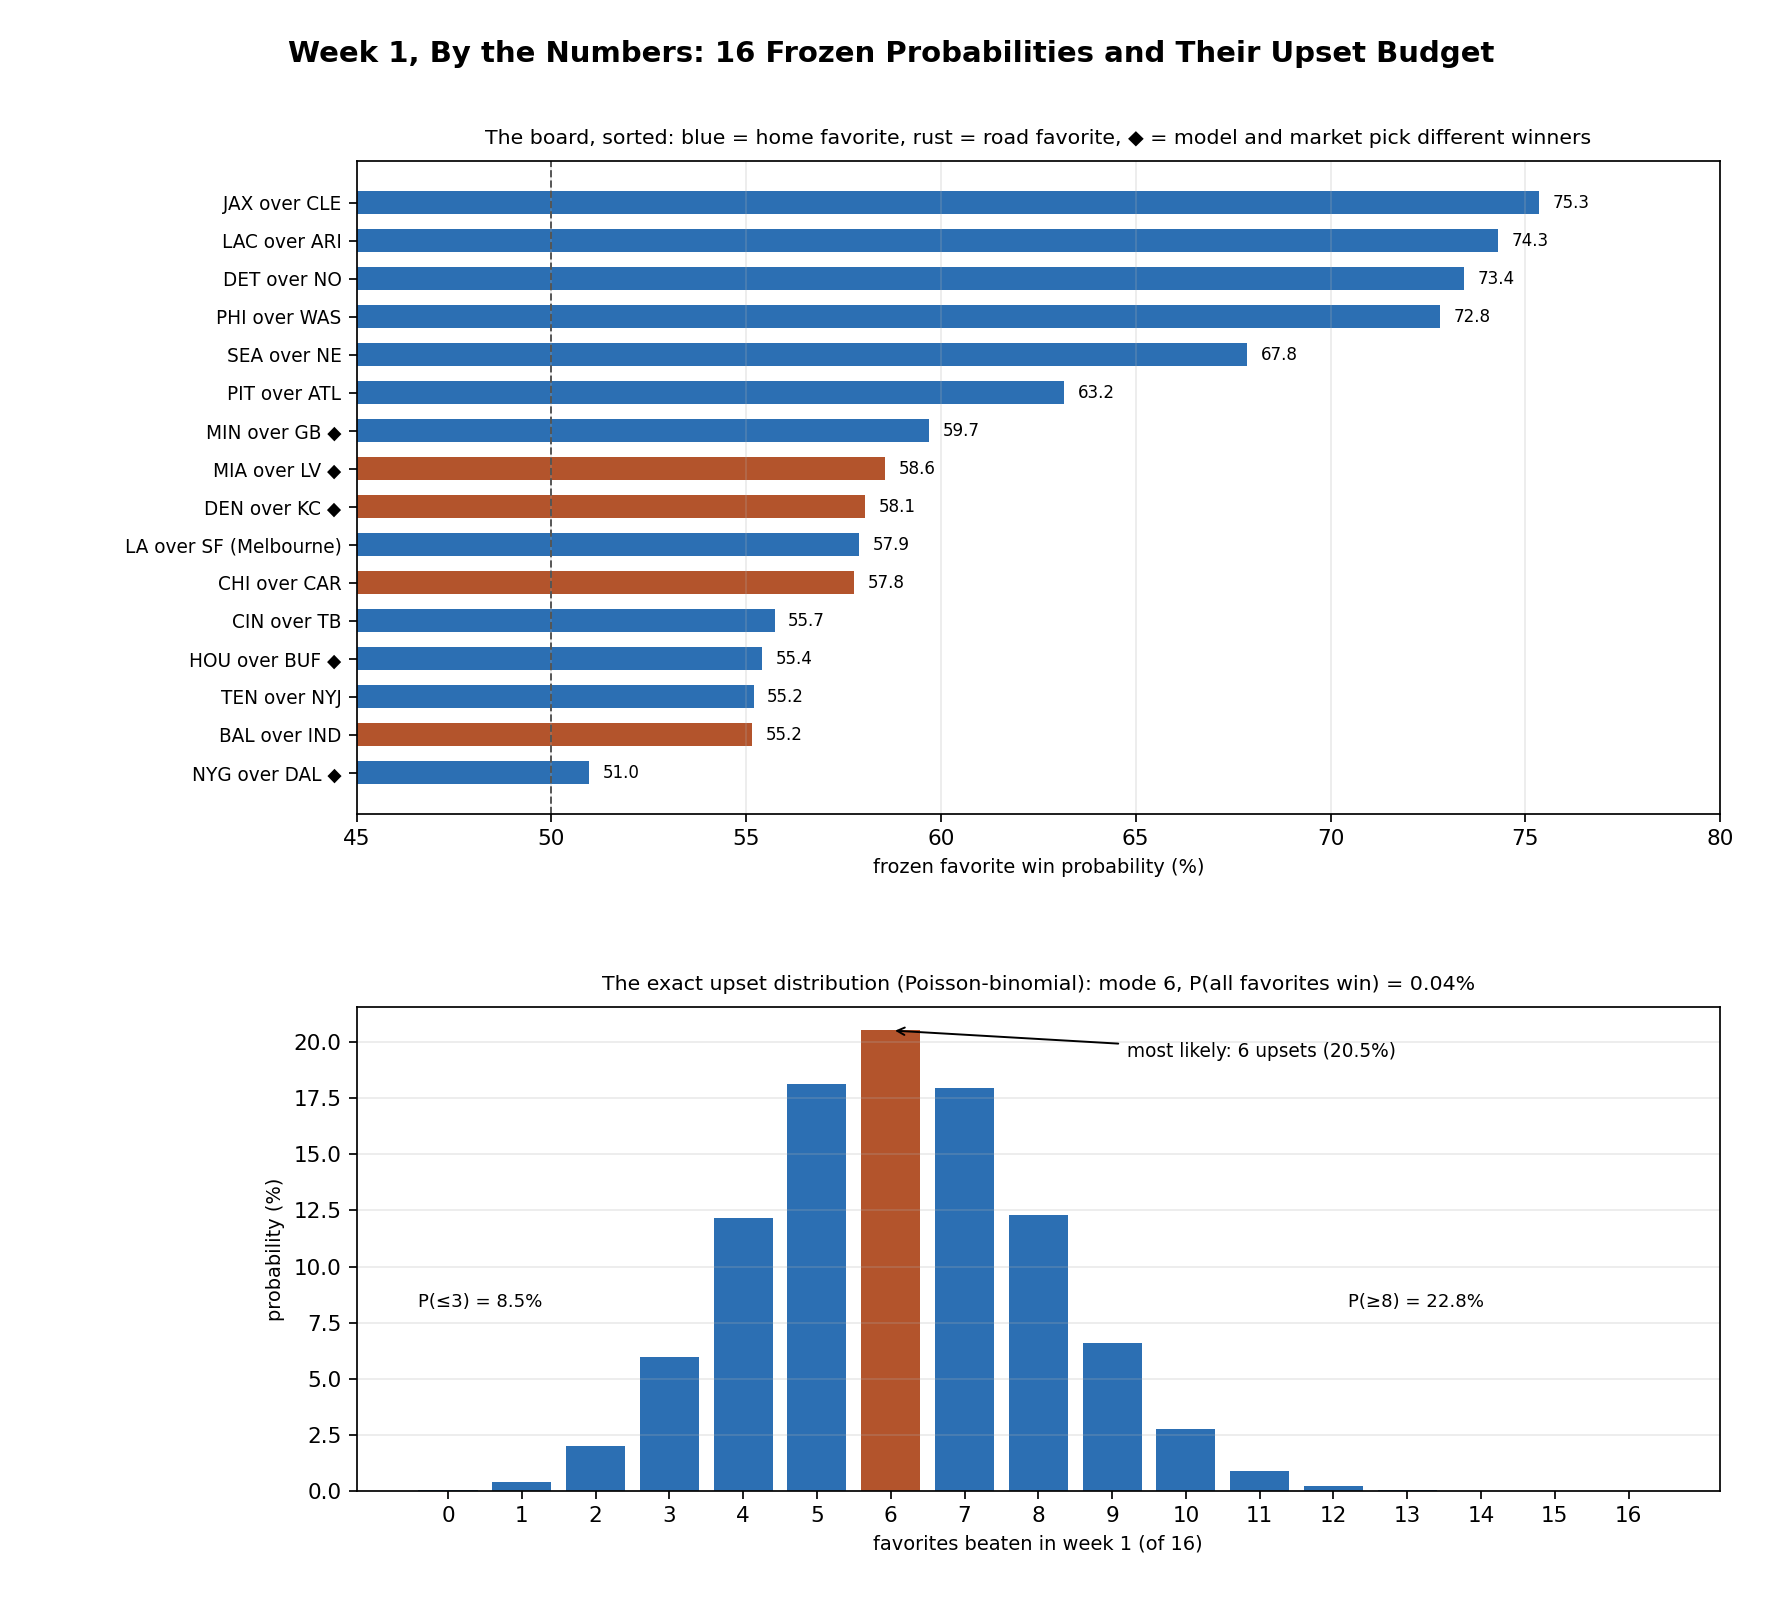
The whole page in one exhibit: sixteen modest edges on top, and underneath, what modest edges add up to — a week that most likely beats six of its favorites.
Is Week 1 Actually Weirder? The File Says: Barely, If At All
Opening-week folklore says anything can happen before the league settles in. The file can check that. Across every completed regular-season game from 1999 through 2025, true home sites only: week-1 home teams are 231-191-3, a .544 rate, against .562 across all weeks — 1.8 points lower, which at 425 games is a z of −0.75. A lean, not a finding. Closing-spread favorites tell the same story: 277-144 in week 1 (.658) against .667 season-wide, a z of −0.37. Week 1 favorites and home teams do slightly worse than usual, by margins indistinguishable from noise across a quarter-century of openers.
Which is quietly reassuring for the board above: the model treats week 1 like any other week, and history declines to object. What week 1 actually is, per the signal page, is one game of evidence that doubles a playoff prior — important to have graded, useless to have predicted loudly.
Honest Limitations
- The ratings are frozen on purpose and blind by construction. Locked August 12: no training camp, no injury reports, no September roster news. The five market quarrels above are mostly quarrels about exactly that blindness, and the market is not obviously wrong.
- Probabilities are not picks. The table prints the model's better-than-even side because grading demands one, but a 55% favorite loses 45% of the time, and this board's own arithmetic budgets six of its sixteen "picks" to be wrong.
- 2025 records are context only. Three mirrored records above look like symmetry; the ratings disagree, and the ratings are the model's actual opinion.
- The market snapshot is dated. It is the schedule file's pull, quoted for reproducibility, not today's board; lines move daily. The disagreement count could look different by kickoff.
- The historical base rates use true home sites only and closing spreads as the favorite definition; pick-em games and ties are excluded where stated. Different conventions shift the third decimal, not the conclusion.
Reproduce It
Everything above is a deterministic function of three published files: the ledger's data/predictions.json (ratings and frozen probabilities), the schedule file data/games.csv (results 1999–2025, the 2026 rows, the market snapshot), and the power rankings' opening snapshot. The build script make_week1_predictions_2026_chart.py re-derives all 16 probabilities from the ratings, recomputes every aggregate, distribution value, base rate, and disagreement named on this page — 63 assertions — and draws the exhibit. If any number here stops matching the ledger, the build fails rather than publish the drift.
Further Reading
- The prediction ledger — where these 16 numbers get graded, then repriced weekly all season.
- The week-1 slate — the games themselves: head-to-head ledgers, the Wednesday opener, the market lines quoted here.
- The miss budget — the season-length version of this page's 6.09.
- The week-1 signal — what winning an opener has historically meant.
- The international slate — why Melbourne costs the Rams six and a half points of probability.
- The power rankings — the same ratings, sorted, with the tier lines these matchups cross.
- Win totals and playoff odds — the same frozen board, summed and simulated.
Go deeper
Want the code behind these metrics? Work through the 43-chapter NFL analytics tutorial.
Browse tutorials Free tools