Sequels Are Rare, and the Champion Keeps Winning Them
When the Patriots walk into Lumen Field on opening night, they will be attempting something the league has quietly made very difficult: beating the team that just beat you in the Super Bowl, the very next season. Difficult first because the game itself rarely exists — Super Bowl participants come from opposite conferences, and the schedule formula only crosses their paths every few years — and second because when the sequel does get scheduled, the champion has won five of the six played since 1999. This page is the full census: every next-regular-season Super Bowl rematch in this site's twenty-eight-season data file, what happened in each, and what the morning after a Super Bowl loss has historically looked like for the loser.
The rarity is worth a number of its own. Twenty-seven Super Bowls sit in the file, seasons 1999 through 2025. The first fourteen of them — every Super Bowl from 1999 through 2012 — produced zero next-season rematches. All six sequels have come since the 2013 title game, three of them in the last four seasons, helped along by the seventeenth game's extra cross-conference matchup (the AFC–NFC ledger covers that rotation math). A Super Bowl rematch used to be a scheduling accident; it is becoming a scheduling feature.
The Six Sequels
| Super Bowl | Result | Next-season rematch | Sequel result | Champion? |
|---|---|---|---|---|
| 2013 season | SEA 43, DEN 8 | 2014 wk 3, DEN at SEA | Seahawks 26–20 | Won again |
| 2015 season | DEN 24, CAR 10 | 2016 wk 1, CAR at DEN | Broncos 21–20 | Won again |
| 2016 season | NE 34, ATL 28 | 2017 wk 7, ATL at NE | Patriots 23–7 | Won again |
| 2022 season | KC 38, PHI 35 | 2023 wk 11, PHI at KC | Eagles 21–17 | Avenged |
| 2023 season | KC 25, SF 22 | 2024 wk 7, KC at SF | Chiefs 28–18 | Won again |
| 2024 season | PHI 40, KC 22 | 2025 wk 2, PHI at KC | Eagles 20–17 | Won again |
Champions 5, avengers 1, average sequel margin 6.7 points. The lone successful revenge belongs to the 2023 Eagles, who walked into Arrowhead in week 11 and returned the 38–35 heartbreaker with a 21–17 win. Everyone else who tried — Peyton Manning's Broncos in Seattle, Cam Newton's Panthers on Denver's banner night, Matt Ryan's Falcons in Foxborough, the 2024 Niners and 2025 Chiefs against their tormentors — lost the sequel too. Note what home field did not do: the home team won only three of the six. The champion won twice as the road team (Kansas City at San Francisco in 2024, Philadelphia at Kansas City in 2025). Whatever is carrying champions through these games, it travels.
And one row matters enormously for this week: the 2016 kickoff game is the only previous week-1 sequel, and it is a near-exact template for Wednesday — the champion hosting its banner night against the team it had just beaten in February. Denver won it 21–20, on a missed Carolina field goal at the end. The 2026 opener is the seventh sequel, the second to open a season, and the second hosted by the champion on banner night. The sample says champion; the sample is one game.
The Morning After: What Losing a Super Bowl Costs the Next Year
Zoom out from the head-to-head and ask the broader question: what does the Super Bowl loser's next season look like? Across the twenty-six losers with a completed follow-up season in the file (1999–2024 Super Bowls), the answer is: still good, noticeably diminished. Losers averaged 9.15 wins the next year at a .567 clip; the champions they lost to averaged 10.81 at .668. Ten of the twenty-six losers — 38% — fell under .500 entirely. The floor is the 2003 Raiders (4–12 the year after their Super Bowl); the freshest entry is the 2025 Chiefs, who followed their 40–22 loss to Philadelphia with a 6–11 collapse. The ceiling is real too: the 2000 Titans went 13–3, and six other losers came back with 12-win seasons. Losing the Super Bowl is not a curse; it is a headwind.
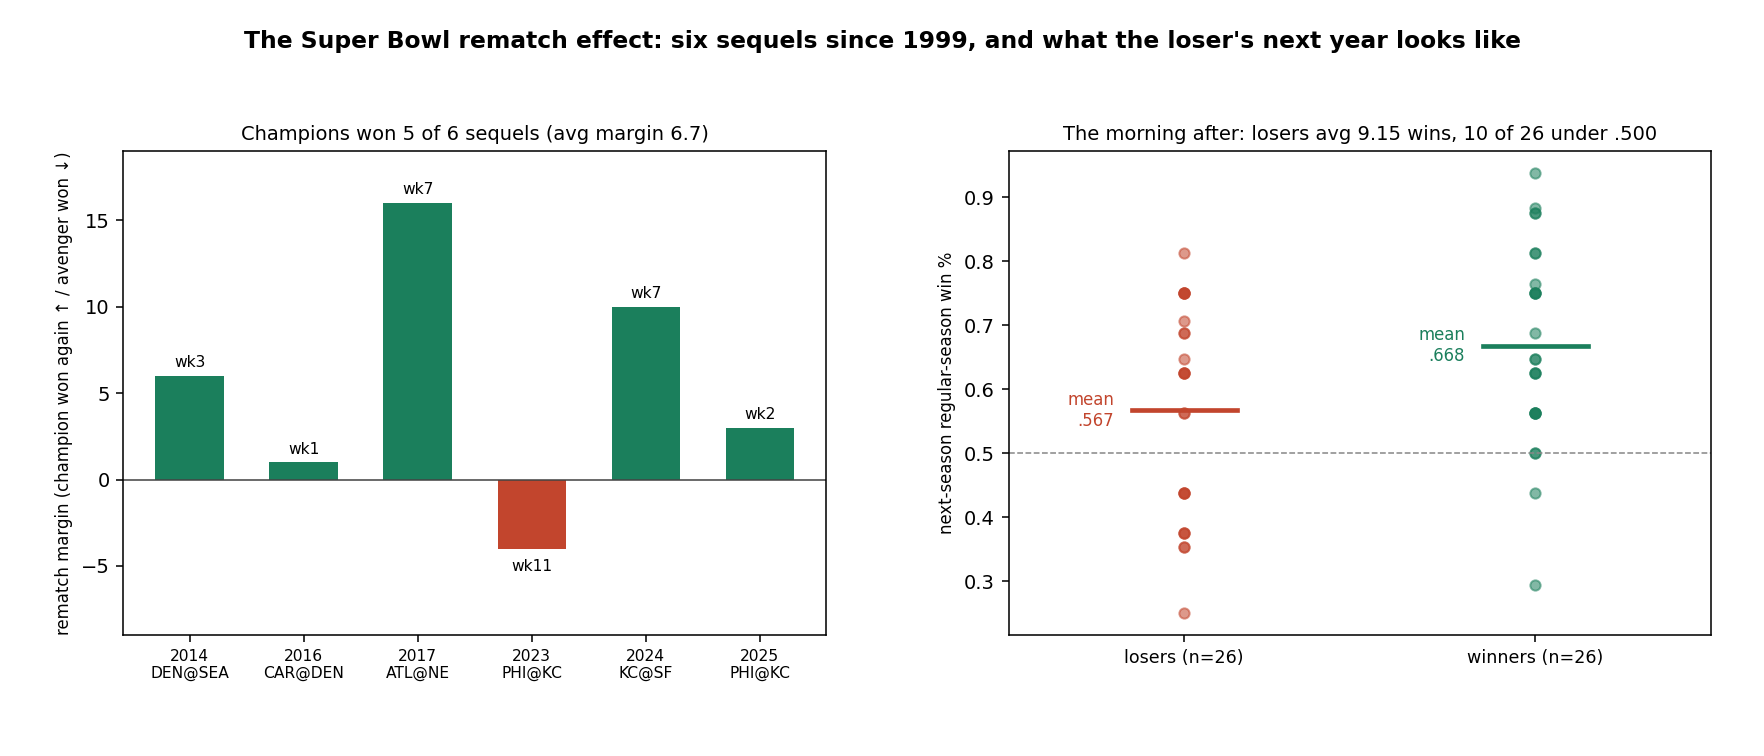
Which brings the story to New England, the current holder of the loser's ticket. History's base rate for their 2026 says nine wins and change; this site's model, which knows nothing of curses, prices them well above that — sixth on the board at 1592.8 with playoff odds of 72.1% — because ratings care what you did (14–3, a Super Bowl trip), not what it felt like. The tension between the base rate and the rating is the honest frame for the Patriots' season: the average Super Bowl loser regresses about a win and a half; New England was so far above average last year that even that regression leaves a playoff team.
Six Games Is Six Games
Now the part this site refuses to skip. n = 6. A 5–1 split in six games is two coin flips from 3–3; no significance test survives contact with a sample this size, so none is claimed. The sequels are also not a random draw — they happen when the scheduling rotation happens to align, and lately because the seventeenth game manufactures cross-conference matchups. The loser's-next-year table is sturdier (n = 26) but carries its own honest asterisk: Super Bowl losers are, by construction, teams at their peak, and some regression to the mean is arithmetic, not psychology. What this page supports saying is modest and real: sequels have been rare, champions have kept winning them, home field hasn't been the reason, and the one previous banner-night sequel went to the champion by a single point. It is a pattern, not a law — and on Wednesday it gets a seventh data point either way.
Verification
Every Super Bowl participant pair is derived directly from the games file's own game_type == "SB" rows — no hand-kept list — and every number here (all six sequel scores, weeks, hosts and margins; the 5-of-6; the 2016 kickoff game; the 27 Super Bowls and the zero-rematch drought through 2012; the 9.15/10.81 averages, the 10-of-26, the Raiders' 4–12, the Chiefs' 6–11, the Titans' 13–3, the six other 12-win follow-ups) is recomputed and asserted by explainer_src/make_sb_rematch_chart.py: 43 assertions, run at every build. As of September 3, 2026.
Further reading
- Opening Night 2026 — today's companion: the NE–SEA series, the 129.8-point gap, and the 67.9%
- The AFC vs NFC Ledger — the cross-conference rotation that decides whether a sequel can even exist
- Best Record vs the Super Bowl — the adjacent study: what regular-season dominance is worth in February
- Week 1 Predictions — the sequel priced, alongside the other fifteen openers
- The Week 1 Signal — what opening results actually predict, so Wednesday's outcome gets read at the right volume
- 2026 Playoff Odds — where the model puts the current Super Bowl loser, base rates be damned
- Data: the nflverse games file bundled at
/data/games.csv(Super Bowls identified bygame_type; scores as recorded).
Go deeper
Want the code behind these metrics? Work through the 43-chapter NFL analytics tutorial.
Browse tutorials Free tools