The Number Nobody Publishes
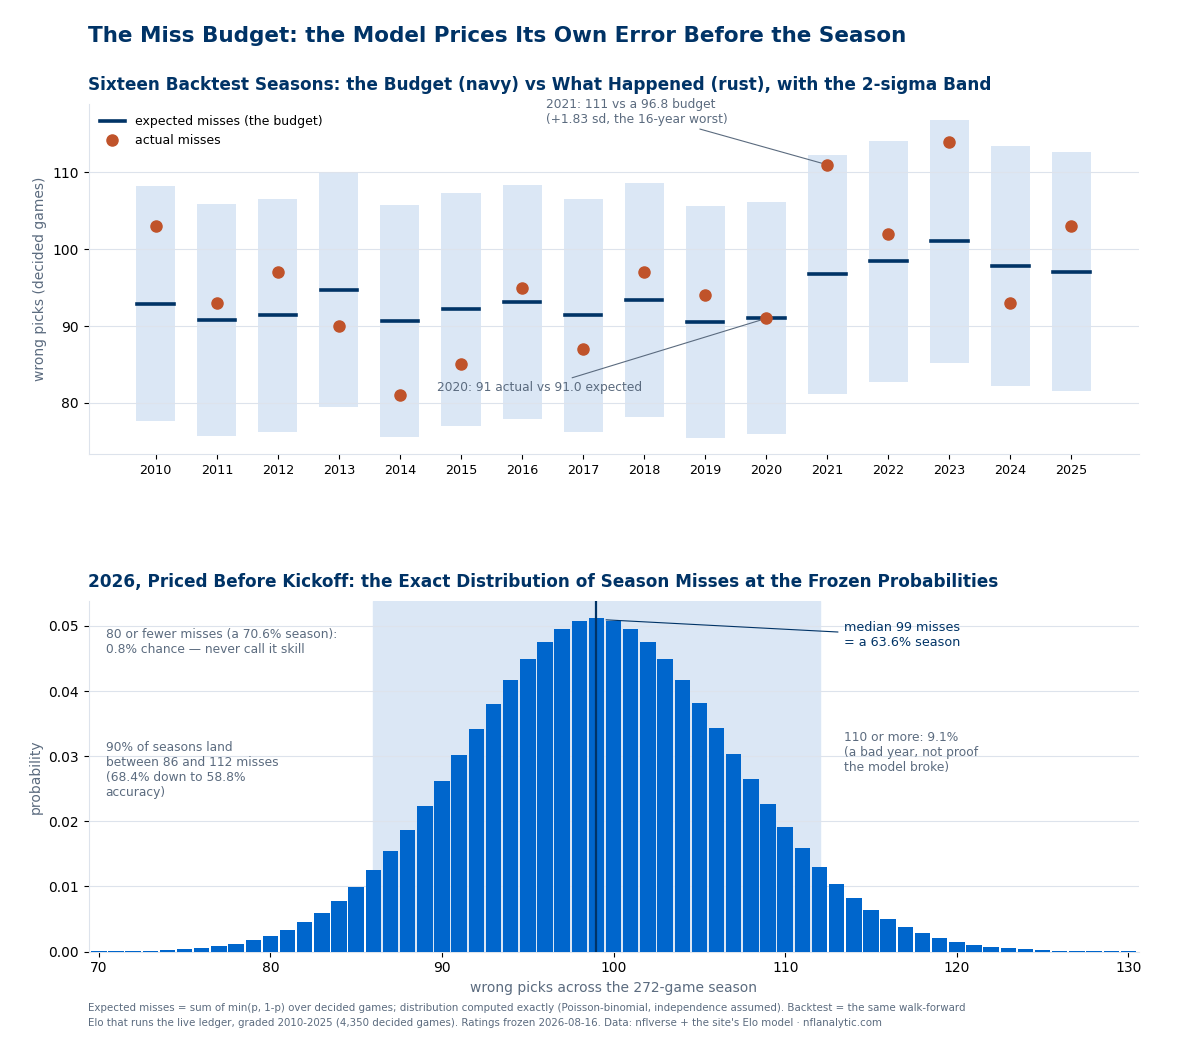
Every outlet that predicts football publishes its picks. Almost nobody publishes, in advance, how often the picks are going to be wrong — even though any model that outputs probabilities has already computed it. Sum each game's chance of fooling the model — min(p, 1−p), the probability the favorite loses — across the ledger's frozen pricing of all 272 games of 2026, and the answer is 99.11 expected wrong picks. This page publishes that number ten days before kickoff, together with its exact distribution, so that when the misses arrive nobody at this site gets to act surprised, and nobody reading it has to guess whether a bad month is noise or news.
What the Board Already Knows About Itself
Nothing here is a new model. The probabilities are the same frozen opening ratings the win-totals page sums into expected wins (its anchors — Seattle 12.17, Las Vegas 4.87 — are re-asserted on every build of this page) and the playoff-odds page simulates into January. The only change is what gets added up. A team's wins are Σ p; the model's misses are Σ min(p, 1−p). The first sum flatters nobody in particular. The second sum flatters nobody at all — it is the model stating, game by game, how much of the season it does not expect to call.
The total is driven by how modest NFL edges actually are. The average favorite on the 2026 board is priced at 63.6%, and 62 of the 272 games open under 55% — near coin flips, which contribute 29.6 expected misses on their own, just under a third of the whole budget. At the other end, the 42 games with a favorite at 75% or better still owe 8.7 misses, because the average such favorite loses about once in five tries. Locks lose too, on schedule, and the budget says so before it happens.
The Exhibit: the Budget Kept, Then Pre-Committed
| Favorite priced at | Games | Expected misses |
|---|---|---|
| 50–55% (coin flips) | 62 | 29.6 |
| 55–60% | 49 | 21.1 |
| 60–65% | 45 | 17.0 |
| 65–70% | 45 | 14.7 |
| 70–75% | 29 | 8.0 |
| 75%+ (the locks) | 42 | 8.7 |
All 272 games of the 2026 regular season, priced from the frozen opening ratings with the +48 home edge (waived on the eight neutral-site rows). Rows sum to the 99.1-miss budget.
The Two Ends of the Board
The single most confident row on the whole 2026 schedule is Arizona at Seattle in week 9: the top-rated team in the league (1674.6) at home against the NFC's lowest rating (1394.4), priced at 86.9%. That is as sure as this model ever gets about a football game — and it still amounts to losing the matchup about one time in eight. If Seattle drops it, the correct reading is not that the ratings were wrong; it is that the one-in-eight came up, which is a thing one-in-eights do several times every season.
The other end is stranger and better. The closest game on the board is Green Bay at Tampa Bay in week 4, at 50.07% for the home side — and the coin flip is manufactured by the schedule. Green Bay's rating is 47.5 points better than Tampa Bay's, and the +48 home edge cancels it almost exactly. The model's purest toss-up of 2026 is not two equal teams; it is a better team on the road, offset to four decimal places by where the game is played. Whoever loses that one costs the ledger half a miss it had already paid for.
Sixteen Seasons of Keeping the Budget
A pre-committed budget is only worth something if the model has a record of hitting it. The top panel runs the test: the same walk-forward Elo that prices the live ledger, replayed over every season from 2010 to 2025 (1999–2009 burn in the ratings), each season's expected misses computed from the probabilities the model held at the time of each game, then compared with the misses that actually happened. Across 4,350 decided games the budget said 1,503.2 and reality said 1,536 — the model ran about two misses a season hotter than its own estimate, a mild overconfidence it inherits from the same calibration wobble the model page documents, and which this page carries openly rather than tuning away after the fact. The identity checks out against that page's headline too: 1 − 1536/4350 is the published 64.7% backtest accuracy.
No season in sixteen left the two-sigma band. The worst overshoot was 2021 — 111 misses against a 96.75 budget, +1.83 standard deviations, in the first year of the 17-game schedule (a bigger slate raises the budget mechanically: more games, more scheduled misses). The 2023 season landed nearly as high at 114 against 101.03. The best year for picking, 2014, came in nine and a half under budget at 81 against 90.70 — and the model was not smarter that year, the coin flips just cooperated. And 2020, the season with no crowds and every reason to break a home-edge model, finished at 91 misses against an expectation of 91.04. The budget is not a guess dressed as rigor. It has sixteen consecutive receipts.
Week 1's Share, Frozen Already
The first installment is already on the books. The ledger froze its sixteen week-1 probabilities on August 12 — the slate page walks through them — and their miss budget is 6.09 games. Read that against the scoreboard before reacting to it: a 10–6 opening week is the budget, not a stumble; 12–4 would be running ahead; 8–8 would be one bad-but-ordinary week, about a sigma and a half of noise on sixteen games. Every one of those frozen rows reproduces from the published ratings to within rounding — this page re-derives all sixteen on every build, and pins the Melbourne opener (San Francisco at the Rams, neutral, 57.9%) to the exact ledger value the international-games page asserts against.
Why a Site Would Do This to Itself
Sometime around late October, the model will be on a bad run — the distribution more or less guarantees a stretch where the misses bunch — and the ordinary move in this business is to quietly stop mentioning the record until it recovers. Publishing the budget first forecloses that. The season-long claim is on this page in advance: around 99 misses, 90% band 86 to 112. Under 86 is a hot year the model does not deserve credit for; over 112 is a cold one that, at a 9-ish percent prior, is more likely variance than breakage — but past the band's edge is where we would start checking the machinery instead of the dice. Either way the standard was set when nobody knew the outcomes, which is the only time a standard means anything.
It also sets the terms for reading anyone else's season. A tout advertising 70% against the spread is easy to price now: at this board's probabilities, straight-up 70% (81 misses or fewer) is roughly a 1.5% event for an honestly-calibrated model — and picking against the spread is harder than picking winners. The miss budget is not just this model's honesty policy; it is a general-purpose detector for numbers that are too good to have been earned.
What This Page Can and Cannot Tell You
Three honest caveats. First, the 99.11 prices all 272 games at the frozen opening ratings, but the live ledger re-prices each week as results move the ratings — so the season's graded budget will drift from this page's static one. The backtest is the defense: its budgets were computed the walk-forward way, ratings wandering all season, and still landed inside two sigma sixteen times running. Second, the exact distribution assumes games miss independently. A September quarterback injury makes one team's misses correlate, which fattens the tails beyond what the bottom panel shows; the band is honest arithmetic, not a law. Third, ties: the grading rules exclude them from accuracy (they count half in Brier), so a tie or two shifts the denominator by a game — noise at this scale, but stated. And a scope note: misses are the bluntest way to grade a probability model — the Brier score, which punishes confident wrongness specifically, is the sharper instrument and has its own page. This page uses misses anyway because misses are what everyone actually argues about in November.
Every number above is recomputed and asserted on each build by explainer_src/make_miss_budget_2026_chart.py — 42 assertions, including the exact distribution's percentiles, all sixteen frozen week-1 rows, the win-totals anchors, and the full sixteen-season backtest table — so if the ratings, the schedule file, or the ledger ever change, this page fails loudly rather than aging quietly into fiction. The ledger starts spending the budget on September 10.
Further reading
- The model, fully stated and backtested: Our Prediction Model, Fully Stated — the Elo mechanics, the Brier score, and the calibration table this page inherits.
- The live scoreboard: the 2026 prediction ledger — frozen before kickoff, graded after, misses kept on the page.
- Elo-Implied 2026 Win Totals — the same probabilities summed the flattering way
- Elo-Implied 2026 Playoff Odds — the same probabilities simulated 20,000 times
- The 2026 Week 1 Slate — the sixteen games whose 6.09-miss installment comes due first
- How Often Favorites Actually Win — the market's version of the same humility, by spread size
- One-Score Games — why half the schedule prices near a coin flip in the first place
- Schedule and results: the nflverse games file bundled at
/data/games.csv; ratings and frozen probabilities in/data/predictions.json.
Go deeper
Want the code behind these metrics? Work through the 43-chapter NFL analytics tutorial.
Browse tutorials Free tools