The Question: Which Conference Is Actually Better?
Every season the NFL quietly plays a home-and-home series between its two halves — 64 interconference games a year under the old 16-game formula, 80 a year since the seventeenth game arrived in 2021 — and nobody keeps the standings. Fans argue AFC-versus-NFC from vibes: quarterback lists, Super Bowl memories, whichever conference just embarrassed the other on a Sunday. The schedule file bundled with this site has been keeping score the whole time. Since the 2002 realignment gave the league its current 32-team, two-16 shape, the two conferences have met 1,616 times in the regular season. This page counts them.
The Exhibit: 24 Seasons of a Series Nobody Tracks
| Window | AFC record | AFC rate | What it was |
|---|---|---|---|
| 2002–2010 | 323–251–2 | .5625 | a nine-year run, three standard errors from a coin flip |
| 2011–2025 | 500–536–4 | .483 | the NFC quietly winning the back half |
| 2021–2025 (17-game era) | 196–203–1 | .491 | dead even |
| All-time, 2002–2025 | 823–787–6 | .511 | 0.9 standard errors from .500 — noise range |
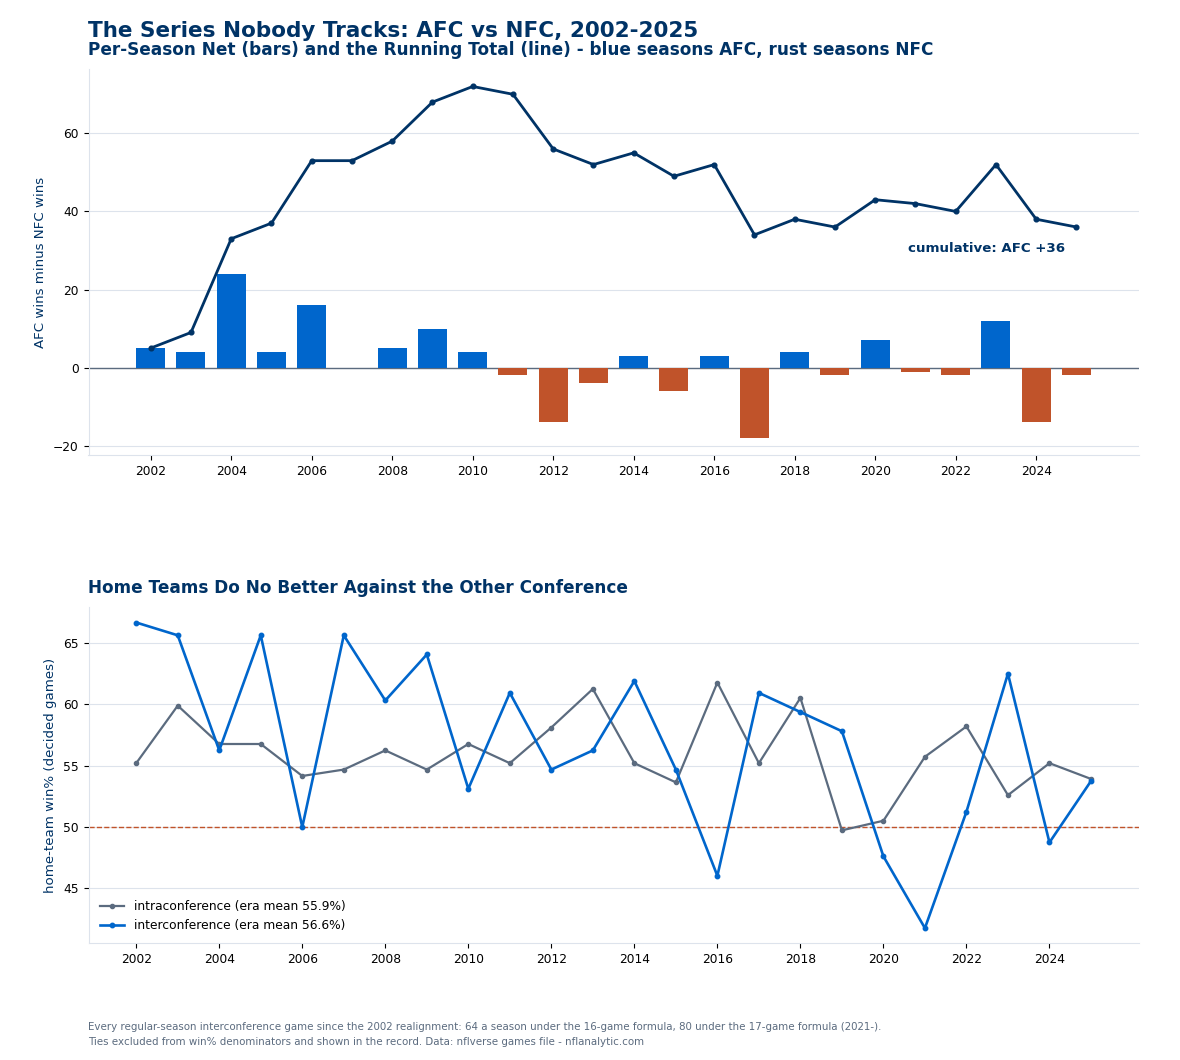
Rates count the six ties as half a win each. Season series: AFC has won 13, the NFC 10, with 2007 finishing 32–32. The AFC's longest run of season-series wins is five straight; the NFC's is three.
The Shape of the Lead: Old Money
The cumulative line in the exhibit is the whole story in one stroke. It climbs almost monotonically from 2002 to 2010 — the AFC banked a +72 net in nine seasons, peaking with the 2004 massacre, 44–20, the largest single-season margin either side has ever posted — and then goes flat and slowly leaks. Over the fifteen seasons since, the NFC has taken back exactly half of it, and the ledger sits at +36.
The modern series is not calm, though; it just nets to nothing. The NFC's best season is 2017, 41–23, a +18 that stands as the largest NFC year of the whole era. In 2023 the AFC won the year 46–34, a +12 that looked like the old order reasserting itself — and the very next season the NFC answered 47–33, +14, matching 2012 for the second-biggest NFC year on file. Two adjacent seasons, 26 net wins swung, no trend. That whiplash is what a genuinely even series looks like when you only sample 80 games of it a year.
Home Field Doesn't Care About the Conference Line
There is a folk theory that interconference games should tilt further toward the home team — less familiar opponents, longer average travel, once-every-four-years road buildings. The file says no. In decided interconference games since 2002, home teams have won 56.6% (912 of 1,610). In decided intraconference games over the same span: 55.9% (2,571 of 4,598). Eight-tenths of a point, on samples that large, is nothing to build a theory on — the two season-by-season lines in the exhibit's bottom panel cross constantly. Whatever home field advantage is made of, the conference label of the visitor is not an ingredient, which squares with what the rest-and-scheduling numbers found about travel generally: the schedule's small asymmetries mostly wash out.
The Super Bowl Mirror
The file's postseason rows run one round deeper than the regular-season series and tell a compatible story: of the 27 Super Bowls from the 1999 season through 2025, the AFC has won 15, the NFC 12. Same direction as the regular-season ledger, same modest size, and an even smaller sample — 27 games decides nothing, and this page will not pretend otherwise. What the two ledgers rule out together is any version of the story where one conference is durably, structurally better. The AFC era of the 2000s was real. The present is a coin flip with a famous logo on each side.
The 2026 Slate: 80 Games, and the NFC Holds the Extra Home Dates
The 2026 schedule file carries exactly 80 interconference games, and every club plays exactly five. Four division pairings supply 64 of them: AFC East–NFC North, AFC North–NFC South, AFC South–NFC East, AFC West–NFC West. The other sixteen are the seventeenth games — same-place finishers from the divisions a club is not paired with — and in 2026 all sixteen are hosted by the NFC, which is why the interconference home count splits 48–32 in the NFC's favor. That alternating extra home date is not nothing: it is the structural coin the league flips between the conferences every year, and it is measured on the 17-game era page.
If you want the series priced game by game rather than counted, the 2026 schedule-strength table already folds these 80 games into every club's slate, the week-1 page prices the openers, and eight of the 80 aren't home games for anyone — the international slate plays them in Melbourne, Rio, London, Paris, Madrid, Munich and Mexico City with the home edge switched off.
What This Page Can and Cannot Tell You
A conference is a label, not a team. Nobody coaches the AFC; the series is the sum of 1,616 individual matchups shaped by schedule rotation, quarterback careers and luck, and "the AFC leads .511" compresses all of that into one number. Compressed honestly, though, the number is instructive mostly for how small it is: .511 across 1,616 games sits 0.9 standard errors from a coin flip — if the two conferences had been exactly equal since 2002, a lead this size or bigger happens by chance more often than not. The one window that clears the noise bar is 2002–2010: .5625 over 576 games is three standard errors out, a real era of AFC superiority that happens to coincide with the primes of a short list of quarterbacks the reader can name without help. The seasons since have been statistically indistinguishable from even — which is itself the finding.
Every number above is recomputed and asserted on each build by explainer_src/make_afc_nfc_chart.py — 33 assertions, including the 64-games-a-season and 80-games-a-season formula checks for every year in the window, the era splits, the significance arithmetic, and the 2026 pairing grid — so if the schedule file changes, this page fails loudly rather than aging quietly into fiction.
Further reading
- Theory: Chapter 5: Statistical Foundations for Football Analytics — a free chapter at DataField.dev on when a rate like .511 means anything.
- Schedule and results: the nflverse games file bundled at
/data/games.csv(every game since 1999; this page uses the 2002 realignment era). - The Season That Can't Break Even — what the seventeenth game did to records, including the alternating ninth home date the NFC holds in 2026
- 2026 Schedule Strength — the same 80 games, priced into every club's slate
- 2026 International Games — the eight interconference games with no home team at all
- Home Field Advantage — what the 56.6% in the bottom panel is made of
- The Week 1 Signal — the same discipline applied to a different folk theory
Go deeper
Want the code behind these metrics? Work through the 43-chapter NFL analytics tutorial.
Browse tutorials Free tools