Eight Games With No Home Team
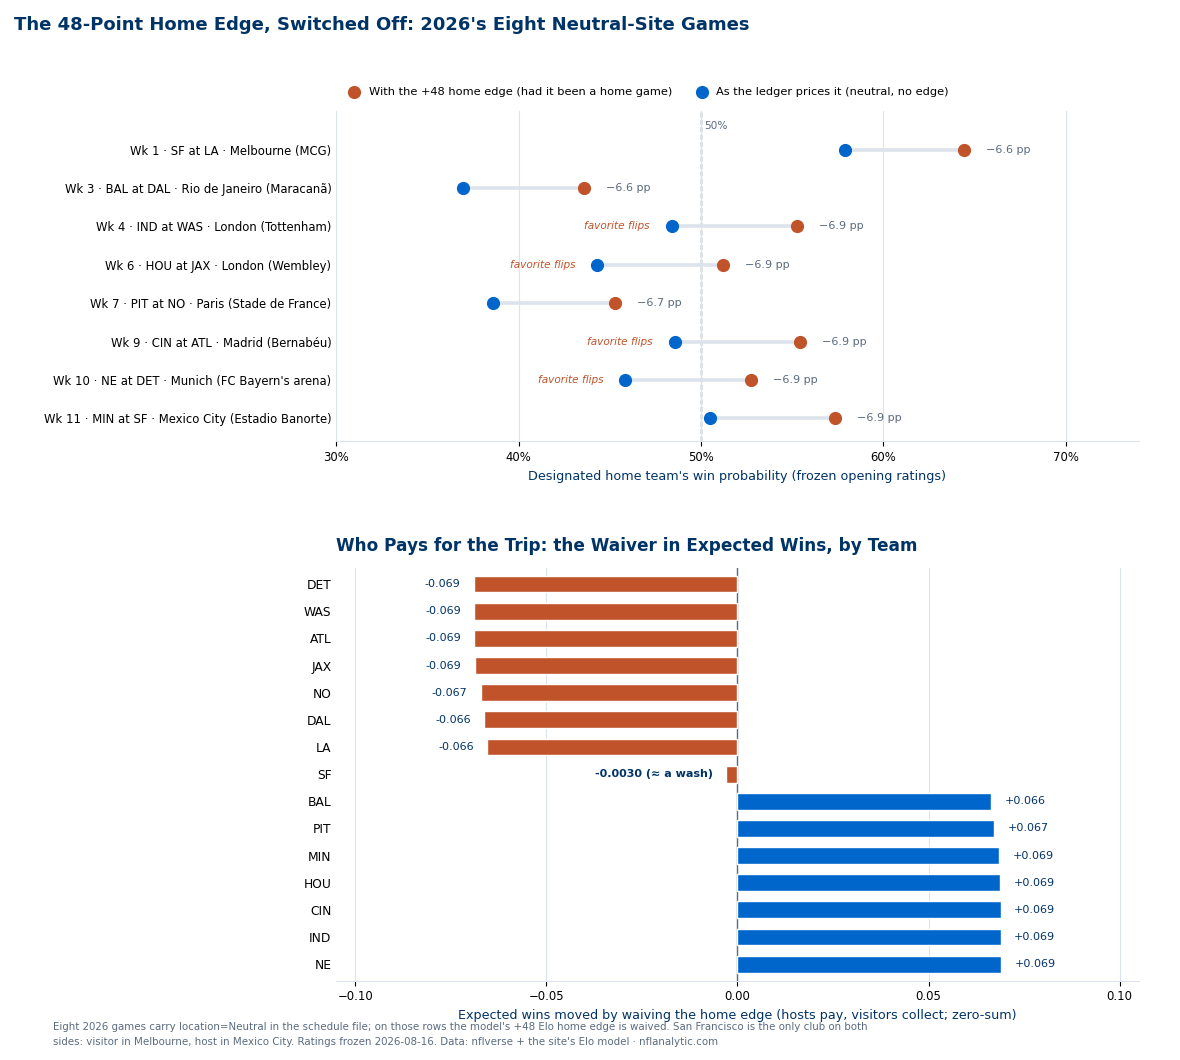
The 2026 schedule sends eight regular-season games outside the United States, from Melbourne in week 1 to Mexico City in week 11, and every one of them is played in a stadium neither club has ever called home. The schedule file marks all eight location=Neutral, and on exactly those rows the prediction ledger waives the +48 Elo points it hands a home team everywhere else. That waiver is the whole subject of this page: it is worth 0.543 expected wins, it is taken from seven clubs and handed to seven others, and it turns four designated “home” favorites into underdogs before a snap is played.
What 48 Elo Points Is Actually Worth
The ledger's home edge is a flat 48 Elo points added to the home team's rating before the logistic converts a rating gap into a win probability. Its effect is largest where the game is closest: a 48-point edge is worth its theoretical maximum of 6.90 percentage points when two teams are otherwise dead even, and shrinks as the matchup gets lopsided. That is why the haircuts below cluster so tightly — six of the eight games sit near enough to a coin flip that the waiver takes almost the full 6.9 points, and only the two most unbalanced games (San Francisco–Los Angeles at 6.55 and Baltimore–Dallas at 6.64) come in measurably under the ceiling.
Nothing here is a new model. Every probability on this page is the frozen opening rating set the ledger published on August 16 and grades weekly, run through the same arithmetic; the only manipulation is turning one constant on and off. The week-1 row for San Francisco at the Rams is asserted against the live ledger file itself (p_home = 0.5789, neutral = true), and the expected-wins anchors from the win-totals page — Seattle 12.17, Las Vegas 4.87 — are re-checked on every build so this page and that one cannot silently drift apart.
The Exhibit: Every Game, and Who Pays
| Wk | Game | Venue | Host win % (neutral) | If it were home | Haircut |
|---|---|---|---|---|---|
| 1 | SF at LA | Melbourne Cricket Ground | 57.9 | 64.4 | −6.55 pp |
| 3 | BAL at DAL | Maracanã, Rio de Janeiro | 37.0 | 43.6 | −6.64 pp |
| 4 | IND at WAS | Tottenham Hotspur, London | 48.4 | 55.3 | −6.89 pp |
| 6 | HOU at JAX | Wembley, London | 44.3 | 51.2 | −6.88 pp |
| 7 | PIT at NO | Stade de France, Paris | 38.6 | 45.3 | −6.72 pp |
| 9 | CIN at ATL | Bernabéu, Madrid | 48.6 | 55.4 | −6.89 pp |
| 10 | NE at DET | FC Bayern's arena, Munich | 45.9 | 52.8 | −6.90 pp |
| 11 | MIN at SF | Estadio Banorte, Mexico City | 50.5 | 57.3 | −6.85 pp |
Probabilities are the designated home team's. Venues as coded in the schedule file's own stadium field.
Four Favorites That Stop Being Favorites
In four of the eight games the waiver does something more than shave a probability — it changes who the model likes. Indianapolis at Washington (Tottenham), Houston at Jacksonville (Wembley), Cincinnati at Atlanta (Madrid) and New England at Detroit (Munich) all feature a designated host the ratings would favor at home — 55.3%, 51.2%, 55.4%, 52.8% — and all four drop under 50% once the edge comes off. Washington falls to 48.4, Jacksonville to 44.3, Atlanta to 48.6, Detroit to 45.9. These are the four games where a fan looking at a schedule and counting “home” games will be most wrong about what the season actually asks.
The bottom panel prices that in the only currency that matters over a season. The waiver is exactly zero-sum: seven designated hosts pay between 0.066 and 0.069 expected wins each, seven visitors collect the same, and the whole slate moves 0.543 expected wins around the league. San Francisco is the only club that appears twice — the visitor in Melbourne, the host in Mexico City — and nets −0.003, which is as close to nothing as the arithmetic gets. It is worth being clear-eyed about the size of this: a sixteenth of a win is not a season. It is, however, larger than the margin that decided several 2025 playoff berths, and it is systematic rather than random, which is the definition of a thing worth pricing.
Does the History Support Switching It Off?
This is the page's real test, because waiving the edge entirely is an assumption, not a measurement. The schedule file carries every neutral-coded regular-season game back to 2003, and the record of the clubs designated as home in them is 30–35–1 across 66 played games — a .462 win rate. Over the same span, teams in genuine home stadiums won at .563. So the designated-home nameplate has historically been worth less than nothing: the point estimate says these clubs have been slightly worse off than a coin flip, not slightly better.
Read that carefully, though, because 66 games is a small sample and the teams involved were not a random draw — Jacksonville alone accounts for a large share of them, and clubs sent abroad are not always good clubs. The honest conclusion is narrow and sufficient: there is no evidence in this record that a designated home team abroad retains a home advantage, and therefore zero is a defensible number where +48 plainly is not. Whether the true value is zero or mildly negative, 66 games cannot say. The ledger uses zero because it is the assumption that requires the least invention.
The Ninth Game, and an Honest Inconsistency
There is a ninth international game on the 2026 schedule that this page's eight-game analysis leaves out, and the reason is worth disclosing rather than hiding. Philadelphia at Jacksonville, week 5, at Tottenham Hotspur Stadium — the same London ground that hosts Indianapolis–Washington a week earlier — is coded location=Home in the schedule file, not Neutral. So the model hands Jacksonville the full +48 in London, pricing the Jaguars at 54.7% where a neutral coding would put them at 47.8%. That would be a fifth favorite flip.
The coding is not arbitrary — Jacksonville has treated London as a second home market for over a decade, and the argument that it functions as a home game for that club is real. But the site should not pretend the line is clean: two games in the same stadium, five weeks apart, priced under two different rules. The ledger follows the schedule file rather than overriding it, which keeps the model reproducible and the disagreement visible. If the Jaguars lose that game as a 54.7% favorite, this paragraph is where to look first.
One more scheduling note the file supports: of the sixteen team-slots on the neutral slate, only three — Jacksonville, New England and New Orleans — get a bye the following week. The other thirteen fly home and play on schedule. The model knows nothing about jet lag, and this page will not invent a coefficient for it; it is simply a real asymmetry sitting outside what the ratings can see.
What This Page Can and Cannot Tell You
The ratings are frozen at their opening values and know nothing about injuries, holdouts or anything that has happened since August 16 — the same constraint that governs the win totals and the playoff odds. The home-edge constant is a single league-wide number, not a per-stadium one; real home advantage varies by venue, altitude and travel, and a flat 48 is an average standing in for a distribution. The waiver treats all eight trips as identical, which they obviously are not — a west-coast club flying to Melbourne in week 1 and a Detroit team crossing to Munich in November are not the same imposition, and this model cannot tell them apart.
What it can tell you is exactly this: eight games on the 2026 schedule have a home team on the label and no home team on the field, the ledger prices them accordingly, four of them flip, and the total redistribution is a little over half a win. Every number above is recomputed and asserted on each build by explainer_src/make_international_2026_chart.py — 28 assertions, including the cross-page anchors, the zero-sum of the team ledger and the historical neutral-site record — so if the schedule file or the ratings ever change, this page fails loudly rather than aging quietly into fiction. The ledger grades all eight games as they are played.
Further reading
- Related chapter: Chapter 25: Home Field Advantage Deep Dive, DataField.dev.
- Schedule, locations and stadium fields: the nflverse games file bundled at
/data/games.csv(272 regular-season rows for 2026, plus every neutral-coded game back to 2003). - Ratings and win probabilities: the site's own frozen opening Elo set, published in
/data/predictions.jsonand graded weekly on the prediction ledger. - Elo-Implied 2026 Win Totals - the expected-wins anchors this page is asserted against
- Elo-Implied 2026 Playoff Odds - what these eight games are worth once seeding is simulated
- Home Field Advantage - where the +48 constant comes from and what it is actually measuring
Go deeper
Want the code behind these metrics? Work through the 43-chapter NFL analytics tutorial.
Browse tutorials Free tools