Thirty-Two Septembers, Priced
Every team page on this site carries its 2026 schedule with a strength-of-schedule number built the way previews always build it, from last year's records. That method has already been graded here, and it grades badly. This page prices the opening month a different way: take each team's four games in weeks 1 through 4, run each through the same arithmetic the frozen ledger uses — the rating gap, a 48-point home edge, waived at the three neutral sites — and add up what the ratings expect. Then check, across 512 team-seasons, how much an October record should be read against that calendar.
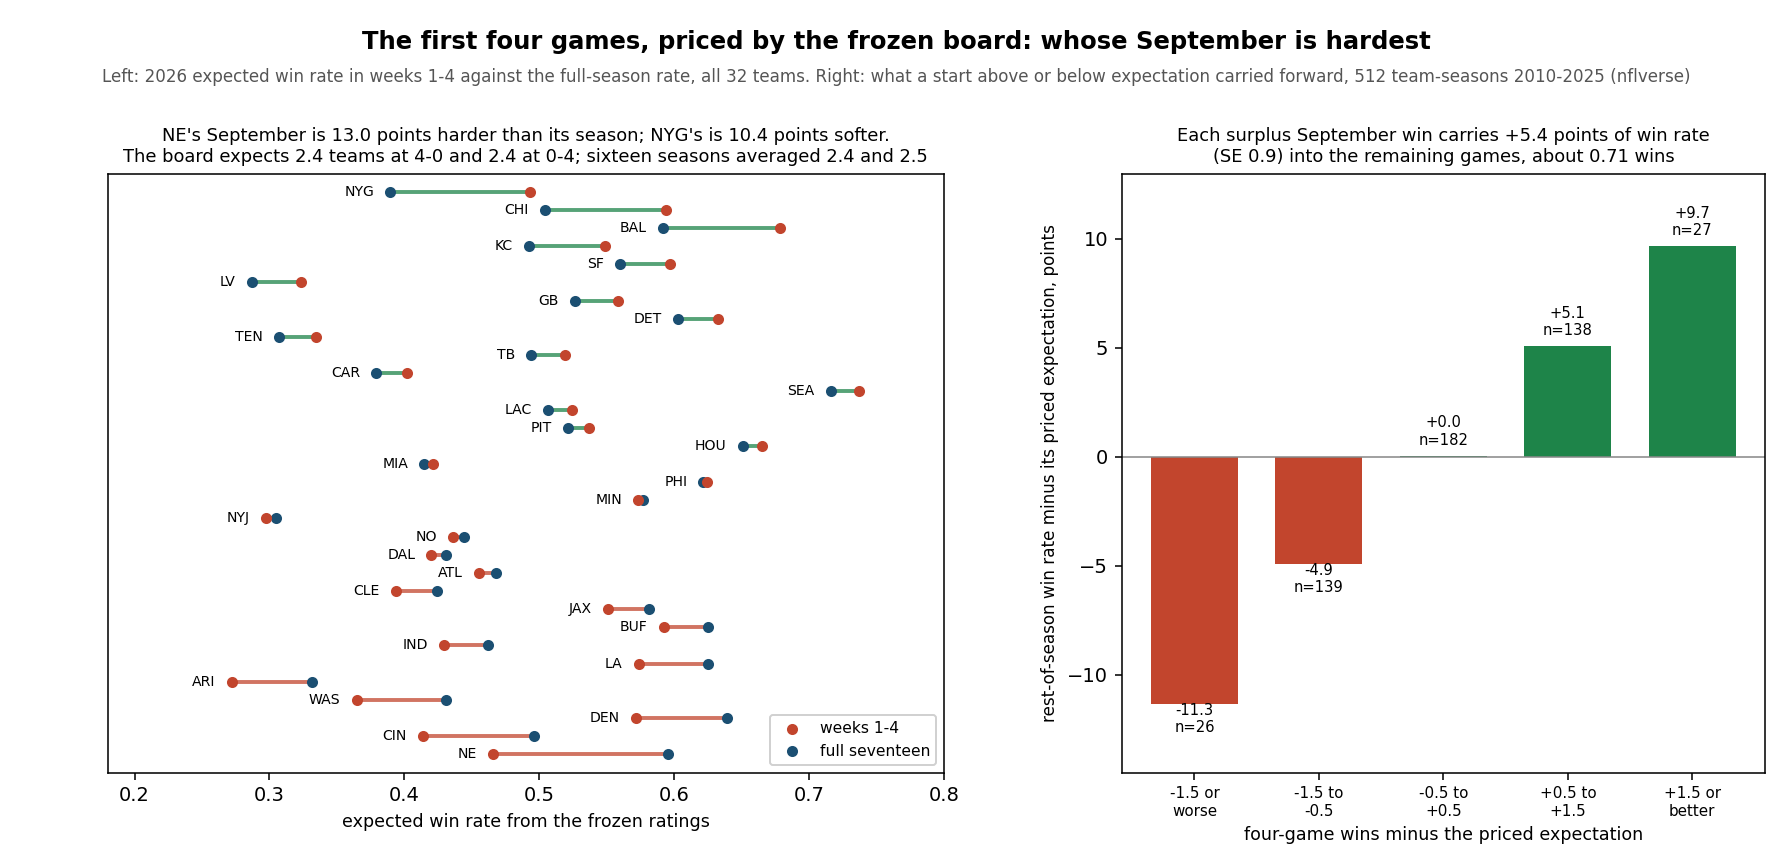
The answer to the first question is lopsided. New England has the hardest opening four in the league by the ratings: at Seattle, home to Pittsburgh, at Jacksonville, at Buffalo — an effective opponent, rating plus travel, of 1617.1, one home game, and an expected 1.86 wins of four. That is a .465 pace for a team the same ratings expect to play .595 over seventeen, a gap of 13.0 points, the largest back-load on the board. Baltimore has the softest: at Indianapolis, home to New Orleans, Dallas in Rio de Janeiro on a neutral field, home to Tennessee — an effective opponent of 1416.8, 200.3 rating points below the Patriots', and 2.71 expected wins. The Giants are the most front-loaded: three home games in four, 1.97 expected wins at a .49 pace for a team priced at .39 over the season, 10.4 points softer than their own year.
The Arithmetic, and Two Cross-Checks
For each of the 272 scheduled games the harness computes the home side's probability exactly as nfl_elo.expected_home does — 1 / (1 + 10−(gap + edge)/400) with the edge at 48 or, for Melbourne in week 1, Rio in week 3 and London in week 4, zero — and credits the visitor with the remainder. A team's effective opponent is the opponent's rating plus 48 when the team travels, minus 48 when it hosts, unchanged at a neutral site: the strength the team actually faces, from where it stands. The front-load is the team's expected win rate over its first four minus its expected rate over all seventeen; it is positive when September is softer than the season.
Two checks anchor the table to pages already published. The thirty-two season sums reproduce the win-totals page to the hundredth — Seattle 12.17, Houston 11.06, Las Vegas 4.87 — and the opening-four sums add to exactly 64, sixteen games a week for four weeks. Every team plays all four weeks; the first byes fall in week 5.
The Exhibit
All Thirty-Two, Hardest to Softest
| Team | Weeks 1–4 | Exp. wins | Eff. opp. | Front-load | 4-0 | 0-4 |
|---|---|---|---|---|---|---|
| NE | at SEA, PIT, at JAX, at BUF | 1.86 | 1617.1 | −13.0 | 4.1% | 7.1% |
| ARI | at LAC, SEA, at SF, at NYG | 1.09 | 1570.0 | −6.0 | 0.5% | 27.5% |
| DEN | at KC, JAX, LA, at SF | 2.29 | 1562.1 | −6.7 | 10.5% | 3.3% |
| WAS | at PHI, at DAL, SEA, IND (London) | 1.46 | 1558.5 | −6.6 | 1.5% | 15.6% |
| LA | SF (Melbourne), NYG, at DEN, at PHI | 2.29 | 1555.1 | −5.1 | 9.7% | 2.5% |
| BUF | at HOU, DET, LAC, NE | 2.37 | 1549.3 | −3.3 | 11.7% | 2.5% |
| CIN | TB, at HOU, at PIT, JAX | 1.66 | 1544.0 | −8.2 | 2.6% | 11.1% |
| JAX | CLE, at DEN, NE, at CIN | 2.20 | 1526.4 | −3.0 | 8.1% | 3.3% |
| DAL | at NYG, WAS, BAL (Rio), at HOU | 1.68 | 1521.1 | −1.1 | 2.6% | 10.3% |
| IND | BAL, at KC, HOU, at WAS (London) | 1.72 | 1519.3 | −3.3 | 3.3% | 10.4% |
| NYJ | at TEN, GB, at DET, at CHI | 1.19 | 1518.6 | −0.8 | 0.6% | 23.3% |
| MIA | at LV, at SF, KC, at MIN | 1.69 | 1517.7 | +0.6 | 2.6% | 10.2% |
| LAC | ARI, LV, at BUF, at SEA | 2.10 | 1509.0 | +1.8 | 4.6% | 2.8% |
| MIN | GB, at CHI, at TB, MIA | 2.29 | 1503.0 | −0.3 | 10.3% | 3.0% |
| ATL | at PIT, CAR, at GB, at NO | 1.82 | 1502.4 | −1.3 | 3.8% | 8.0% |
| CLE | at JAX, at TB, CAR, PIT | 1.58 | 1499.2 | −3.0 | 2.0% | 12.5% |
| CAR | CHI, at ATL, at CLE, DET | 1.61 | 1495.7 | +2.3 | 2.6% | 12.7% |
| SEA | NE, at ARI, at WAS, LAC | 2.95 | 1494.1 | +2.1 | 29.3% | 0.5% |
| GB | at MIN, at NYJ, ATL, at TB | 2.23 | 1493.1 | +3.2 | 8.9% | 3.3% |
| PIT | ATL, at NE, CIN, at CLE | 2.15 | 1490.8 | +1.5 | 7.3% | 4.1% |
| PHI | WAS, at TEN, at CHI, LA | 2.50 | 1487.8 | +0.3 | 14.2% | 1.7% |
| NO | at DET, at BAL, LV, ATL | 1.74 | 1484.7 | −0.9 | 2.6% | 8.1% |
| SF | at LA (Melbourne), MIA, ARI, DEN | 2.39 | 1484.2 | +3.7 | 11.2% | 2.0% |
| LV | MIA, at LAC, at NO, KC | 1.29 | 1483.4 | +3.6 | 1.0% | 20.5% |
| HOU | BUF, CIN, at IND, DAL | 2.66 | 1482.6 | +1.5 | 19.0% | 1.1% |
| TEN | NYJ, PHI, at NYG, at BAL | 1.34 | 1478.8 | +2.7 | 0.9% | 17.8% |
| TB | at CIN, CLE, MIN, GB | 2.08 | 1474.1 | +2.5 | 6.9% | 5.0% |
| KC | DEN, IND, at MIA, at LV | 2.20 | 1473.0 | +5.7 | 8.5% | 3.8% |
| DET | NO, at BUF, NYJ, at CAR | 2.53 | 1459.8 | +3.0 | 13.4% | 1.2% |
| CHI | at CAR, MIN, PHI, NYJ | 2.38 | 1457.3 | +9.0 | 11.7% | 2.3% |
| NYG | DAL, at LA, TEN, ARI | 1.97 | 1430.9 | +10.4 | 4.0% | 5.3% |
| BAL | at IND, NO, DAL (Rio), TEN | 2.71 | 1416.8 | +8.7 | 20.3% | 0.9% |
Home games unmarked; "at" is a road game; neutral sites named. Eff. opp. is the mean opponent rating adjusted for where the game is played. Front-load is the opening-four expected win rate minus the season's, in points. 4-0 and 0-4 are the products of the four frozen probabilities.
Chicago is the row to read twice. By the prior-year-records method the Bears own the hardest paper schedule in the league, and by the ratings they still face the hardest full-season slate, an effective opponent of 1525.6 across seventeen. But their September is the third-softest on the board — three home games, an effective opponent of 1457.3, a front-load of +9.0 points — because the hard part of that schedule comes later in the year. Kansas City is the same shape in miniature: 2.20 expected wins against a 1473.0 opening opponent, +5.7 points softer than its season, with Monday night's visitor from Denver the only opening game the ratings call a loss.
What the Board Expects the Standings to Say on October 5
Multiply each team's four probabilities and the board expects 2.41 teams at 4-0 and 2.44 at 0-4 after week 4. Sixteen graded seasons produced 38 unbeaten starts and 40 winless ones, 2.38 and 2.50 a year — the same numbers. The distribution is lumpy in the file (six 4-0 teams in each of 2015 and 2020, none in 2010 or 2014), and it will be lumpy this year too; the expectation is the only part of it the ratings can speak to.
By the products, Seattle is the likeliest 4-0 at 29.3%, Baltimore next at 20.3%, Houston at 19.0%. Arizona is the likeliest 0-4 at 27.5% — 1.09 expected wins, at the Chargers, Seattle, at San Francisco, at the Giants — ahead of the Jets at 23.3% and Las Vegas at 20.5%. New England's opening four gives a team eighth in expected wins a 4.1% chance of 4-0 and a 7.1% chance of 0-4. Six teams host three of their first four (Buffalo, Chicago, Houston, the Giants, San Francisco, Tampa Bay); six host one (Arizona, Atlanta, Green Bay, Miami, New England, the Jets).
What a September Record Is Worth
Now the historical half. For every season from 2010 to 2025 the harness snapshots the engine's regressed August ratings — the same object the frozen 2026 board is — and prices each team's first four games off that snapshot, then compares with what happened. Across 512 team-seasons, the priced expectation correlates with the actual four-game win count at r = .424; its mean absolute error is .788 wins, against .809 for the rule that everybody goes 2-2. Four games are mostly noise, and the ratings buy back about two hundredths of a win of it. The spread tells the same story: actual four-game wins have a standard deviation of 1.05, the priced expectation only .45.
The record itself is loud. The 38 teams that started 4-0 sent 34 to the playoffs; the 40 that started 0-4 sent none. In between, 3-1 sent 87 of 130, 2-2 sent 66 of 172, 1-3 sent 16 of 120. But a record conflates the team with its calendar, and the ratings were built to separate them. So the useful quantity is the surplus: four-game wins minus what the August ratings expected against that specific opening four. Regress the rest-of-season win rate on the preseason rest-of-season expectation and the surplus:
| Four-game surplus | Team-seasons | Rest-of-season, vs expectation | Playoffs |
|---|---|---|---|
| −1.5 wins or worse | 26 | −11.3 pts | 0.0% |
| −1.5 to −0.5 | 139 | −4.9 | 18.0% |
| −0.5 to +0.5 | 182 | +0.0 | 39.6% |
| +0.5 to +1.5 | 138 | +5.1 | 60.9% |
| +1.5 wins or better | 27 | +9.7 | 85.2% |
2010–2025. Rest-of-season is the win rate over the remaining twelve or thirteen games minus the August ratings' expectation for those same games, in points.
The fitted line: each surplus September win carries +5.4 points of win rate into the remaining games (SE 0.9, a z above six), which over thirteen games is .71 wins — while the August expectation itself carries a coefficient of .70 (SE .08), meaning the preseason ratings keep about seventy percent of their authority after a month. A team that beat its priced September by a full win is, on average, a team the August ratings had underrated by about five and a half points of win rate, and that persists.
Does the Schedule's Difficulty Matter on Its Own?
Here is the version of the question people actually ask in October: is a 3-1 start against a hard schedule worth more than a 3-1 against a soft one? Split the 130 3-1 starters into terciles of opening-four difficulty and the answer looks like yes — 26 of 34 against a hard opening four made the playoffs (76.5%), against 31 of 46 (67.4%) for the soft tercile and 30 of 50 in the middle. Then look at the column the split does not control: the hard-schedule 3-1 teams were rated 1550 in August against 1520 for the soft-schedule ones. They were better teams, and the difference is z = 0.90 anyway.
The regression settles it. Final wins on the four-game record, the August rating, and the opening difficulty together: a September win is worth 1.67 final wins, 100 rating points in August is worth .75, and 100 points of opening-schedule difficulty is worth .06, z = +0.21. One standard deviation of difficulty in the file is 34.6 points, so a hard opening month adds about .02 wins of information once you know the record and the rating. The schedule matters, but only through the expectation it changes; as a separate badge on a 3-1 team it is worth nothing measurable. Which is the point of pricing the calendar in advance, as the table above does, instead of adjusting for it afterward by eye.
Worked Example: Two 3-1 Starts
Suppose New England and Baltimore both reach October 5 at 3-1. The Patriots' priced expectation was 1.86, so their surplus is +1.14 wins; at 5.4 points a win over thirteen remaining games that is about +0.80 wins above what the August ratings already expected, and evidence the engine had them too low. The Ravens' expectation was 2.71, so the same record is a surplus of +0.29, worth about +0.21 wins — a team doing roughly what it was priced to do. Run it the other way and 2-2 is on expectation for New England (+0.14) and a −0.71 shortfall for Baltimore, worth about half a win of downgrade over the rest of the year. Same record, four different pieces of news, and the calendar is the whole difference.
What This Page Cannot Tell You
- The ratings are blind on purpose. Frozen August 12 from scores alone: no rosters, no injuries, no September news. "Hardest by the ratings" means hardest by last season's results after regression, and the effective-opponent column will look wrong for any team whose offseason the engine cannot see.
- Effective opponent ignores rest. Week-1 rest is 7 for everyone by the file's convention and the first byes are in week 5, so the opening four is mostly clean, but the Thursday mini-byes the quirks page tallies are not in this arithmetic.
- Weeks 1–4 is not September. Week 4 is played October 1 through 5; the label is a convenience.
- The 4-0 and 0-4 products treat a team's four games as independent, which they are not across teams; the expected counts of 2.41 and 2.44 are exact by linearity, the per-team probabilities are the ratings' honest guess and no more.
- The surplus coefficient is an average over sixteen seasons, 2020 included, and the playoff rates pool the twelve-team and fourteen-team eras. The regression is linear; whether a +3 surplus means three times a +1 is not something 27 team-seasons can establish.
- A .424 correlation is a weak instrument. The priced expectation beats "everyone goes 2-2" by two hundredths of a win. Do not read the 32-row table as a forecast of anyone's record; read it as the calendar's share of that record.
Reproduce It
Two published files: games.csv from nflverse nfldata, bundled at /data/games.csv, and the frozen ledger's ratings at /data/predictions.json. Everything above comes from explainer_src/make_september_schedule_chart.py, which imports the live engine for its pricing function and for the 2010–2025 replay. The 2026 half is a dozen lines:
import json, nfl_elo as E
from collections import defaultdict

R = json.load(open("static/data/predictions.json"))["ratings"]
e4 = defaultdict(float)
for r in E.load_games():
    if not (r["season"] == "2026" and r["game_type"] == "REG" and int(r["week"]) <= 4):
        continue
    h, a = E.canon(r["home_team"]), E.canon(r["away_team"])
    neutral = (r.get("location") or "").strip().lower() == "neutral"
    p = E.expected_home(R[h], R[a], neutral)
    e4[h] += p
    e4[a] += 1 - p
for t in sorted(e4, key=e4.get):
    print(t, round(e4[t], 2))
# ARI 1.09 ... NE 1.86 ... NYG 1.97 ... BAL 2.71  SEA 2.95   (sum 64.0)
The script asserts every figure on this page — the 272-row schedule and the four-games-each structure, the three neutral sites, the win-totals cross-check, all named team values and ranks, the expected 4-0 and 0-4 counts against the sixteen-season record, the 512 team-season correlations and regressions with their standard errors, the tercile table, the surplus bins, and the worked example: 83 assertions, all green as of September 6, 2026.
Further reading
- Related chapter: Chapter 12: Team Efficiency Metrics, DataField.dev.
- Nine Games on One Shelf — today's companion: the week-1 board sorted by how sure the model is
- The 2026 Strength of Schedule — the prior-year-records method for the whole season, and the 23-season audit of how little it forecasts
- Elo-Implied 2026 Win Totals — the same ratings summed over all seventeen games, which this page's season column reproduces
- Reading the 2026 Schedule — rest edges, short weeks and byes, the part of the calendar this page's arithmetic leaves out
- Does Week 1 Mean Anything? — one game of evidence; this page is the four-game version
- Strength of Schedule, Adjusted — why opponent strength should be rated, not read off records
- The 48-Point Home Edge, Switched Off — the three neutral sites in the opening four, priced
- The 2026 season hub and the 32 team pages — each team's full schedule with rest edges, the rows this page prices
- Data: the nflverse games file bundled at
/data/games.csv; ratings and pricing fromexplainer_src/nfl_elo.py, the module that writes the live ledger.
Your team
Kept in this browser only.
Pick the playoffs
Pick the games left and see both conferences’ seeds under the NFL’s tie-breakers.
Go deeper
Want the code behind these metrics? Work through the 43-chapter NFL analytics tutorial.
Browse tutorials Free tools