A Board Shaped Like a Shelf
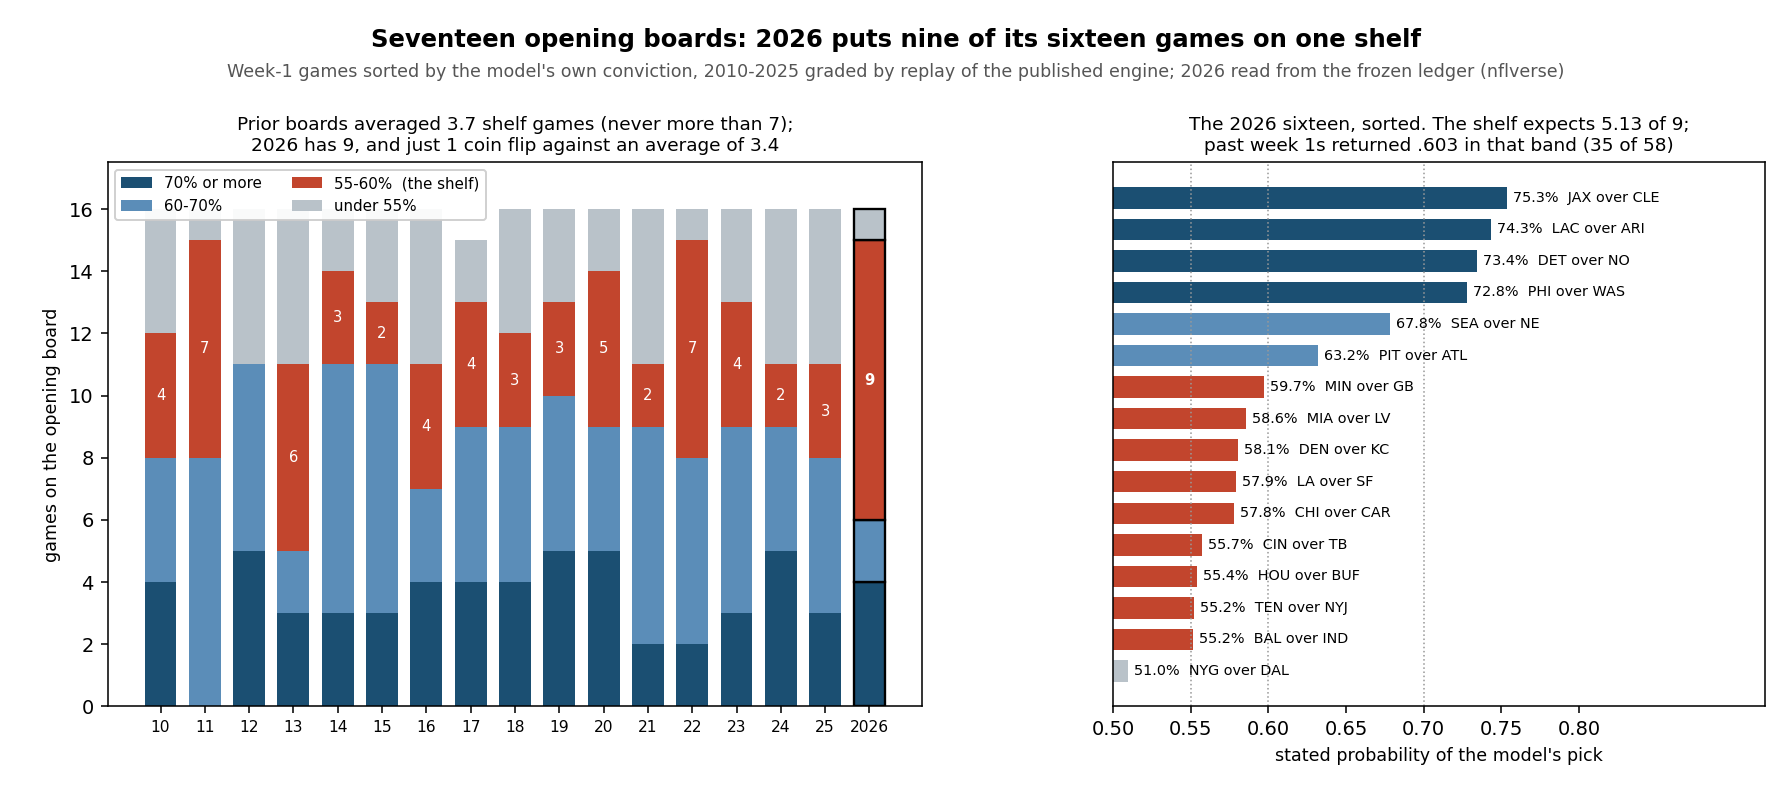
Sort the sixteen frozen week-1 probabilities by how sure the model is — max(p, 1−p), the number it would print next to its own pick — and the 2026 board has a shape no prior opening board has had. Four games sit at 70% or better: Jacksonville over Cleveland at 75.3%, the Chargers over Arizona at 74.3%, Detroit over New Orleans at 73.4%, Philadelphia over Washington at 72.8%. Two sit in the sixties: Seattle over New England at 67.8% and Pittsburgh over Atlanta at 63.2%. One is a coin flip, the Giants over Dallas at 51.0%. And the other nine are stacked between 55% and 60%, on a shelf 4.5 points wide, from Minnesota over Green Bay at 59.7% down to Baltimore over Indianapolis at 55.2%.
The engine that priced those sixteen has been graded on sixteen earlier opening boards, 2010 through 2025, and I sorted every one of them the same way. Those boards averaged 3.4 games at 70% or better, 5.4 in the sixties, 3.7 on the shelf, and 3.4 coin flips under 55%. None ever put more than seven games on the shelf; 2011 and 2022 did, and 2012 put none there at all. Only two prior boards, again 2011 and 2022, had one coin flip or fewer. So the 2026 board is not quieter than usual in any way the learning-curve page's single average would show — its mean confidence of .6196 is the fourth-lowest of seventeen, a hair under 2025's .6199 — but it is narrower. The model has very few games it is sure about, very few it is honestly unsure about, and nine it has priced at nearly the same modest number. Whatever grade the ledger earns on Monday night will be earned on the shelf.
Why the Shelf Exists
The shelf is not an accident of this year's teams; it is what the engine's structure produces when it is not sure. Two identically rated teams, one of them at home, price at 1 / (1 + 10−48/400) = 56.9% for the host, because the home edge is the only thing separating them. After a third of every rating was regressed toward 1505 in August, a lot of pairings are close to identical, and a close pairing on a home field lands within a couple of points of 56.9 by arithmetic. The shelf is the model's way of saying these two are about even, and one of them is home, nine times.
Read the shelf that way and its membership makes sense. Four of the nine are road favorites — Miami at Las Vegas, Denver at Kansas City, Chicago at Carolina, Baltimore at Indianapolis — where the visitor's rating edge slightly outweighs the host's 48 points. Four are home teams the ratings call marginally better: Minnesota, Cincinnati, Houston, Tennessee. And one, the Rams over San Francisco at 57.9%, is a neutral-site game in Melbourne where the ledger waives the home edge and the shelf number is pure rating gap. Every one of the board's four road favorites sits on the shelf; none of the four locks does.
The replay behind these figures is the one the learning-curve page used: the site's engine, imported rather than copied, walked forward over the bundled game log from 1999 and graded from 2010. It reproduces the published backtest exactly — 4,363 games graded, 255 of them week-1 games, 252 decided, a week-1 hit rate of .6468 against a stated .6270. The file holds fifteen week-1 games for 2017, the Miami–Tampa Bay game having been moved, and sixteen for every other season.
The Exhibit
The Sorted Sixteen
| # | Pick | Over | Stated | Band |
|---|---|---|---|---|
| 1 | Jacksonville | Cleveland | 75.3% | lock |
| 2 | L.A. Chargers | Arizona | 74.3% | lock |
| 3 | Detroit | New Orleans | 73.4% | lock |
| 4 | Philadelphia | Washington | 72.8% | lock |
| 5 | Seattle | New England | 67.8% | sixties |
| 6 | Pittsburgh | Atlanta | 63.2% | sixties |
| 7 | Minnesota | Green Bay | 59.7% | shelf |
| 8 | Miami | at Las Vegas | 58.6% | shelf |
| 9 | Denver | at Kansas City | 58.1% | shelf |
| 10 | L.A. Rams | San Francisco (Melbourne) | 57.9% | shelf |
| 11 | Chicago | at Carolina | 57.8% | shelf |
| 12 | Cincinnati | Tampa Bay | 55.7% | shelf |
| 13 | Houston | Buffalo | 55.4% | shelf |
| 14 | Tennessee | N.Y. Jets | 55.2% | shelf |
| 15 | Baltimore | at Indianapolis | 55.2% | shelf |
| 16 | N.Y. Giants | Dallas | 51.0% | coin flip |
The pick is the home team unless marked "at". Stated is the frozen ledger's probability for the pick, locked August 12, 2026. Bands: lock 70%+, sixties 60–70, shelf 55–60, coin flip under 55.
Two more ways this board is small. Its biggest favorite, Jacksonville at 75.3%, is the fifth-smallest top pick of the seventeen boards — only 2011 (.686), 2013 (.718), 2015 (.720) and 2019 (.745) opened with less conviction at the top, against a prior average of .783 and a high of .854 in 2018, New England over Houston. And its two games in the sixties tie 2013 for the fewest; prior boards averaged 5.4 there. The 2026 engine has essentially emptied the sixties into the fifties.
What Each Band Has Returned
A stated number is a promise, and sixteen graded seasons let me check the promise band by band. For every graded regular-season game I bucketed the model's conviction into six bands and counted how often the pick won — once for week 1 alone, once for all weeks.
| Band | Wk-1 games | Wk-1 realized | Wk-1 stated | All-weeks games | All realized | All stated |
|---|---|---|---|---|---|---|
| 50–55 | 55 | .545 | .528 | 778 | .535 | .526 |
| 55–60 | 58 | .603 | .574 | 726 | .583 | .575 |
| 60–65 | 48 | .646 | .624 | 687 | .608 | .625 |
| 65–70 | 37 | .703 | .670 | 623 | .665 | .673 |
| 70–75 | 28 | .714 | .726 | 498 | .697 | .725 |
| 75+ | 26 | .808 | .791 | 850 | .788 | .812 |
2010–2025 regular season, decided games only. Realized is the share of picks that won; stated is the mean of the model's own probability for those picks.
In week 1 the model has delivered at or above its own number in five of six bands; across all weeks it manages that in only two of six. The shelf band specifically has gone 35 of 58 in openers, .603 against a stated .574 — a gap of 2.9 points with a standard error of 6.4, a z of +0.46, which is to say the promise has been kept and nothing more. The all-weeks version of the same band, 423 of 726, is .583 against .575: kept there too.
So here is the shelf's arithmetic for Sunday. By the model's own numbers the nine games expect 5.13 correct; at the band's historic week-1 rate they would expect 5.43. Because the nine probabilities differ slightly, the exact distribution is Poisson-binomial: the shelf finishes 4-5 or worse 33.1% of the time and 7-2 or better 18.0%. The four locks expect 2.96 of 4, and all four winning is a 29.9% event — picks at 70% or better have gone 41 of 54 in past openers, .759 against .758 stated, which is about as calibrated as a number gets. Add the coin flip and the two sixties and the board's 9.91 expected correct is the figure already published as the grading frame.
The Top Pick and the Coin Flip, Sixteen Times
Two rows on any sorted board draw the eye, and both have a sixteen-season record now. The model's most confident week-1 pick has gone 11-5, against 12.53 wins those sixteen picks promised at an average .783. The five losses: New Orleans over Washington in 2012 at .826, Washington over Philadelphia in 2013, Seattle at the Rams in 2015, Tennessee over the Giants in 2022, and Kansas City over Detroit in 2023 at .788. The least confident pick has gone 9-7, a coin flip behaving like one. Neither record is evidence of anything — sixteen games carry a standard error above ten points — and I print them because the temptation on Monday will be to treat Jacksonville over Cleveland or the Giants over Dallas as the board's referendum. They are one game each, and the shelf is nine.
What This Page Cannot Tell You
- The bands are thin in week 1. Twenty-six to fifty-eight games each, standard errors of six to nine points. The five-of-six pattern is consistent with a model that is perfectly calibrated in openers and with one that is a few points modest; it cannot separate those.
- The shape is structural, not a judgment. A regressed rating system with a fixed 48-point home edge will build a shelf near 56.9% whenever its teams look alike. That explains the shelf; it does not tell you whether the nine pairings really are close, and the ratings were frozen on August 12 without rosters or injuries.
- Sorting by the model's number is not sorting by the market's. The predictions page lists the five games where the schedule file's market snapshot picks the other side; all five are shelf games or the coin flip, which is the same statement as this page's from the other direction.
- 2026 is unpriced by history. Every 2026 row on this page is a stated probability and nothing else. The bands' past returns describe the engine's habits, not this week's teams, and a 33% event on the shelf is not an upset when it happens.
- The 2017 board is fifteen games and the band counts are integers, so "never more than seven" is a statement about sixteen small boards, not a law.
Reproduce It
Two files, both published: games.csv from nflverse nfldata, bundled at /data/games.csv, and the frozen ledger at /data/predictions.json. The study and the exhibit come from explainer_src/make_week1_conviction_chart.py, which imports the live engine. The core of the board comparison:
import json, nfl_elo as E
from collections import defaultdict

conf = lambda p: max(p, 1 - p)
eng, boards = E.Engine(), defaultdict(list)
for r in E.load_games():                          # chronological
    if not E.played(r):
        continue
    p = eng.predict(r)                            # priced before it is seen
    if int(r["season"]) >= E.GRADE_FROM and r["game_type"] == "REG" and r["week"] == "1":
        boards[int(r["season"])].append(conf(p))
    eng.feed(r)
led = json.load(open("static/data/predictions.json"))
boards[2026] = [conf(g["p_home"]) for g in led["weeks"]["1"]]

for s, b in sorted(boards.items()):
    print(s, sum(x >= .70 for x in b), sum(.60 <= x < .70 for x in b),
          sum(.55 <= x < .60 for x in b), sum(x < .55 for x in b))
# 2026  4 2 9 1
The script asserts every figure on this page — the replay against the published backtest, all seventeen board shapes and their ranks, the sorted sixteen against the ledger to four decimals, the six bands for week 1 and for all weeks, the shelf's Poisson-binomial, the top-pick and coin-flip records, and the 56.9% even-game mechanism: 108 assertions, all green as of September 6, 2026.
Further reading
- The First Four Games, Priced — today's companion: the same ratings applied to every team's opening month
- The Model Gets Louder, Not Smarter — the board's average confidence by week, and the 9.91-correct grading frame this page's bands add up to
- Week 1 Predictions, By the Numbers — the sixteen rows in kickoff order, with the arithmetic behind each
- Our Prediction Model, Fully Stated — the engine, the constants, and the season-long calibration curve these bands slice
- Home-Field Advantage Is Shrinking — the 48 points that build the shelf, measured
- The Road Favorite Discount That Isn't There — the four road favorites, all of them shelf games
- The prediction ledger and power rankings — the frozen rows, and the ratings behind them
- Data: the nflverse games file bundled at
/data/games.csv; grades produced byexplainer_src/nfl_elo.py, the module that writes the live ledger.
Your team
Kept in this browser only.
Pick the playoffs
Pick the games left and see both conferences’ seeds under the NFL’s tie-breakers.
Go deeper
Want the code behind these metrics? Work through the 43-chapter NFL analytics tutorial.
Browse tutorials Free tools