The Cheapest Numbers on the Calendar
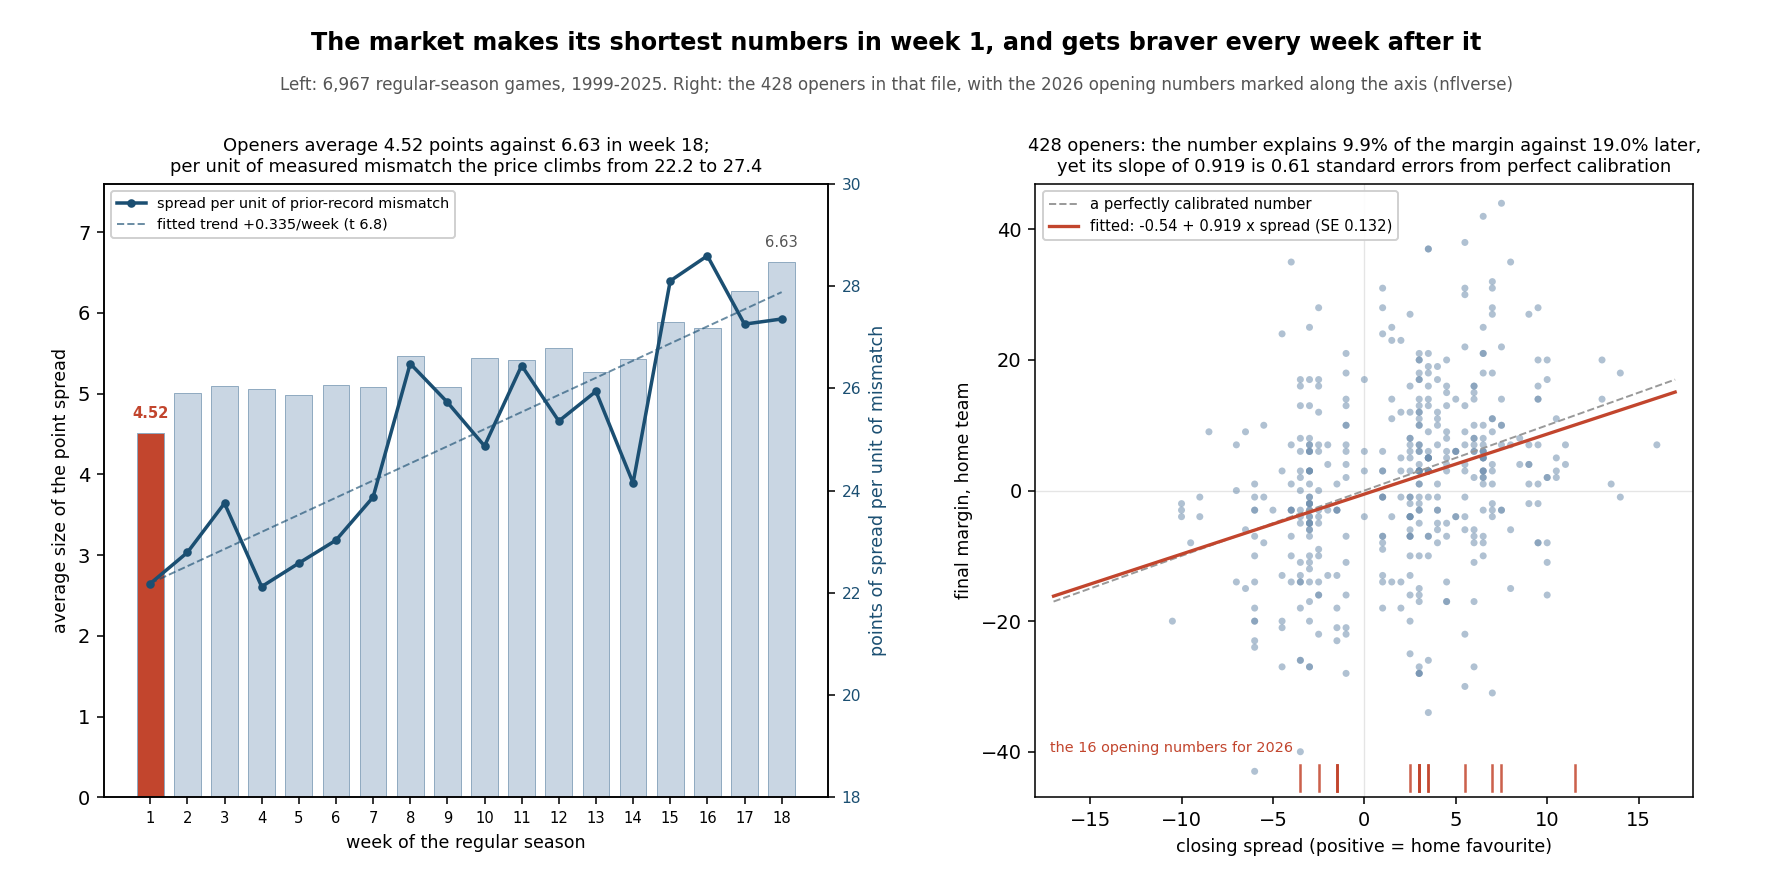
The folklore about opening weekend is that the market is soft: nobody has seen a snap that counts, the books are guessing off last year, and the sharp money waits for week 4. I have never found the first half of that convincing and the file says the second half is wrong. What the file does say, loudly, is something narrower and more useful: the market makes its shortest numbers of the entire season in week 1, and it goes on making longer ones every week until January.
Across the 6,967 regular-season games since 1999 that carry both a closing spread and a final score, the average opener is priced at 4.52 points. The average game in weeks 2 through 18 is priced at 5.40. Week 18 is priced at 6.63. Fit a line through the eighteen weekly averages and the number grows 0.084 points a week, with a standard error of 0.011 — a trend seven and a half standard errors from flat, which for a quantity this noisy is about as clean as football data gets.
The obvious explanation is that openers are more evenly matched. They are not. Measured by the two teams' records the previous season — which in week 1 is close to all the public information there is — the average opener pairs teams .2023 apart, against .2146 for every other week, a difference of 1.56 standard errors and therefore nothing. The schedule is not handing week 1 a set of coin flips. The market is choosing to charge less for the same mismatch: 22.2 points of spread per unit of prior-record gap in week 1, against 25.1 across the rest of the season and 27.4 in week 18.
That is caution, deliberately priced. And the second half of this page is about whether it is worth betting against, which it is not.
How I Measured It
One file, no model. The nflverse game log bundled with this site carries spread_line (positive when the home team is favored), total_line, and the final score for every game. Filtering to regular-season games that have both a number and a result leaves 6,967 games across 27 complete seasons, 1999 through 2025, with per-season coverage running from 248 to 272 games and no gaps. Of those, 428 are openers and 6,539 are not.
Four quantities per week. Length: the average of |spread|. Accuracy: the mean absolute error of the spread as a forecast of the home margin. Information: the raw R-squared of that same forecast — one minus the sum of squared errors over the total sum of squares of the margin, with no refitting, so the number answers "how much of what happened did this number already know". Calibration: the slope of a regression of margin on spread, which should be 1.000 if the number is neither timid nor greedy.
The prior-record control needs the previous season, so it runs 2000–2025 and drops expansion cases: 412 openers and 6,291 later games where both teams played at least eight games the year before. Nothing on this page uses this site's ratings, the ledger, or any model output. It is entirely a page about what the market did.
The Exhibit
Is It the Matchups? No.
The control is the part of this that matters, because "shorter numbers" and "closer games" are trivially confounded. Take each game's two teams, look up their win percentages from the previous season, and use the absolute difference as a crude but entirely public measure of how mismatched the pairing looked before anyone kicked off. Then compare that with the number the market actually made.
| Window | Games | Mean |prior win% gap| | Mean |spread| | Points per unit of gap |
|---|---|---|---|---|
| Week 1 | 412 | .2023 | 4.49 | 22.18 |
| Week 2 | 411 | .2164 | 4.93 | 22.79 |
| Week 4 | 383 | .2269 | 5.02 | 22.12 |
| Week 17 | 412 | .2312 | 6.30 | 27.25 |
| Week 18 | 80 | .2424 | 6.63 | 27.35 |
| Weeks 2–18 | 6,291 | .2146 | 5.39 | 25.10 |
Week 1's pairings are marginally more even than the season's — .2023 against .2146, 1.56 standard errors, which I am not going to call a finding — and the price per unit of that mismatch is 88.4% of the rest of the season's. Regress the eighteen weekly ratios on week number and the slope is +0.335 per week (SE 0.049, t = 6.76), with week number explaining 74.1% of the variation. This is not an opening-weekend quirk. It is a season-long ramp, and week 1 sits at the bottom of it with week 4 a hair below.
The one caveat I will put on the ratio itself: prior-season record is a blunt instrument, and it is bluntest exactly where the offseason did the most work. Denver went 14–3 last year and Kansas City 6–11, the largest prior-record gap on the 2026 opening board, and the market has made Kansas City a 2.5-point home favorite anyway. The ratio is a measure of how much the market leans on last year in aggregate, not a claim that it should lean on it in any one game.
The Number Is Shorter. It Is Not Worse.
Here is where the folklore breaks. If week-1 lines were soft you would expect them to miss by more. They miss by less: the average opener finishes 10.06 points from the number against 10.28 for the rest of the season, which is half a standard error in the market's favor and means nothing except that week 1 is not the disaster it is described as. Among the eighteen weeks, openers rank seventh most accurate. The market's genuinely worst week is week 10, at 10.97.
But mean absolute error is the wrong instrument, and this is the point of the page. A forecast that hedges toward zero can hold its absolute error steady while telling you much less, because the errors it makes are smaller in a smaller world. Ask instead how much of the variation in margins the number already contained:
| Window | Games | Mean |spread| | SD of margin | Mean abs. error | R² of the number | Calibration slope |
|---|---|---|---|---|---|---|
| Week 1 | 428 | 4.52 | 14.01 | 10.06 ± 0.42 | .0992 | 0.919 ± 0.132 |
| Week 2 | 427 | 5.01 | 13.98 | 9.99 | .1830 | 1.111 ± 0.113 |
| Weeks 2–18 | 6,539 | 5.40 | 14.65 | 10.28 ± 0.10 | .1900 | 1.055 ± 0.027 |
| All 6,967 | 6,967 | 5.34 | 14.61 | 10.26 | .1851 | 1.050 ± 0.026 |
The opening number explains 9.9% of the variation in opening-weekend margins. Every other week's number explains 19.0%. That is the real cost of the caution, and it is roughly a halving. Worked through the arithmetic: the market shortens its numbers by 16.3% in week 1 while the games themselves are only 4.3% less spread out (SD 14.01 against 14.65), so almost all of the shortening is the forecast pulling toward zero rather than the world getting smaller. Pull a forecast toward the mean and you protect its average error while giving away its information.
One Sunday fixes most of it. By week 2 the R-squared is already .1830, indistinguishable from the season's .1900. Comparing the two correlations properly — Fisher's transform, .3202 against .4299 — week 1 against week 2 is 1.86 standard errors, which does not clear two on its own; week 1 against the whole rest of the calendar is 2.72, which does. Sixteen games of evidence is the difference between a number that knows a tenth of the story and one that knows a fifth.
Is the Caution Worth Betting Against?
A hedged forecast is exploitable if the hedge is the wrong size. Regress margin on spread and a well-sized number gives a slope of 1.000; a number that is systematically too short gives a slope above 1, because you would have to scale it up to match reality. Openers come back at 0.919 ± 0.132, which is 0.61 standard errors below one — if anything the opening numbers are a shade too long, and the sample cannot tell. There is no lever here.
Nor anywhere else I looked:
- Favorites against the number: 196–218–10 in openers, four games priced pick'em, a cover rate of .4734 and 1.08 standard errors from a coin. Across all 6,967 games, 3298–3450, or .4887.
- Home bias: home teams finish 0.70 points below the opening number on average, standard error 0.64. That is 1.09 standard errors of nothing, against +0.07 ± 0.16 across the file — and the file's own unbiasedness is one of the most durable facts in it.
- Totals: openers went 192–232–4 to the over, a rate of .4528 and 1.94 standard errors under a coin, against .4949 for the whole file. That is the only measurement on this page that gets anywhere near two, and it does not clear it — and I tested eighteen weeks, so a 1.94 somewhere is what you expect from noise alone. Openers scored 42.94 points on average against a 43.41 line. I am reporting it and declining to call it a finding.
What the short numbers do change is your exposure to the key numbers. Because the line sits closer to zero and margins pile up at 3 and 7, 26.2% of openers finished within three points of the number, against 21.4% across the file. A shorter number means more games decided on top of it. That is not an edge; it is a variance profile, and it is worth knowing if you are the sort of person who buys half-points.
The eras agree, for what it is worth. Openers from 1999 to 2012 averaged 4.68 with an R-squared of .1160 and a slope of 0.964 ± 0.180; from 2013 to 2025, 4.34, .0718 and 0.845 ± 0.196. The hedge got slightly deeper and slightly less informative in the modern market, and the two eras' slopes are nowhere near distinguishable.
Wednesday, in That Context
The 2026 opening board is short even by opening-board standards. Its sixteen numbers average 3.97 against the historical week-1 average of 4.52; twelve of the sixteen are priced at 3.5 or shorter, three reach a touchdown, and the longest on the board is Arizona at the Chargers at 11.5. The longest opening number in the whole file, for comparison, is the 16 that Kansas City took at New England in 2008 — New England won by seven and did not cover.
Run the control on it. The sixteen 2026 openers pair teams .1765 apart by last season's records, tighter than the historical opening average of .2023. Multiply that by the historical week-1 rate of 22.18 and you get an expected board of 3.91 points; the actual board is 3.97, a ratio of 22.49. Priced at the rest-of-season rate of 25.10 the same sixteen games would average 4.43. The discount this year is about half a point, and it is exactly the discount the last twenty-six opening weekends took.
Wednesday's game is the cleanest illustration on the board. New England and Seattle both went 14–3 in 2025, so their prior-record gap is exactly zero and the entire 3.5 is home field plus whatever else the market believes. This site's own rating, which reads margins rather than records, has them 81.8 points apart and prices Seattle at .6785 — a substantially stronger opinion than the market's, arrived at from the same 2025 scores. Somebody is going to be wrong about that, and 28.5% of the time in openers the answer lands within 3.5 points of the number and nobody learns much either way.
What This Does Not Show
The spread in this file is the closing number, not the opener-of-the-opener. Whatever softness exists in a Tuesday-morning week-1 line has been traded out of it by kickoff, and this page cannot see the difference. If your claim is that early week-1 lines are beatable, nothing here refutes you; it only says the number the market finished on is as good as any other week's.
Prior-season win percentage is a weak proxy for how mismatched a game looks. It ignores point differential, roster turnover, coaching changes and the entire offseason, and it is exactly the information a naive market would over-use. A better control — a market-independent power rating built only on information available in August — would sharpen the ratio, and would probably shrink the week-1 discount somewhat, because a rating that reads margins would judge some of these pairings closer than their records do. The direction of the season-long ramp is robust to that; its exact size is not.
And the calibration test is weak in week 1 by construction. With 428 games and a short range of spreads, the standard error on the slope is 0.132, so an edge of a tenth of a point per point of spread would be invisible here. I can say the opening market is not obviously mispriced. I cannot say it is priced to four decimal places, and neither can anyone with this sample.
Method and Sources
One published file: the nflverse game log, bundled and served at /data/games.csv. The harness is explainer_src/make_week1_spread_chart.py. The core of the control is six lines:
rows = [r for r in csv.DictReader(open("static/data/games.csv"))
        if r["game_type"] == "REG" and r["spread_line"] and r["home_score"]]

# wpct(season, team) is built from the same file, 8-game minimum
pairs = [(abs(wpct(s - 1, home) - wpct(s - 1, away)), abs(float(r["spread_line"])))
         for r in rows if (s := int(r["season"])) >= 2000]

ratio = mean(spread for _, spread in pairs) / mean(gap for gap, _ in pairs)
# week 1: 22.18   weeks 2-18: 25.10   week 18: 27.35
The script asserts every figure on this page — the file counts and season coverage, the eighteen weekly averages and the trend through them, the prior-record control with its standard errors, the accuracy and R-squared tables, both Fisher comparisons, all three calibration slopes, the against-the-number and totals records, the era split, and the 2026 board including Wednesday's own row: 173 assertions, all green as of September 8, 2026.
Sources: the nflverse public game log (games.csv, 1999–2025 results plus the 2026 schedule and its opening numbers), bundled at /data/games.csv. The efficiency test used here — regressing the outcome on the forecast and asking whether the slope is one — is the standard due to Jacob Mincer and Victor Zarnowitz, "The Evaluation of Economic Forecasts" (NBER, 1969); the correlation comparison uses R. A. Fisher's variance-stabilizing transform (1915).
Further reading
- How Accurate Is the Point Spread? — the whole-file version of the accuracy column above, and where the unbiasedness claim comes from
- What One Game Moves — the same Wednesday night from this site's rating side, priced to the point
- What a 60% Pick Is Worth — the conversion between probabilities and these numbers, fitted on 7,261 games
- Why 3 and 7 Are the NFL's Key Numbers — why a shorter line puts more games on top of the number
- Do Big Favorites Cover? and How Often Does the Favorite Win? — the same market cut by the size of the number instead of the week
- How Accurate Is the Over/Under? — the totals column, done properly
- The Model Gets Louder, Not Smarter — the identical question asked of this site's own forecasts, with the same answer
- Does Week 1 Mean Anything? — what the results themselves predict once the numbers are settled
- The 2026 Week 1 Slate — the sixteen games behind the tick marks in the exhibit
Go deeper
Want the code behind these metrics? Work through the 43-chapter NFL analytics tutorial.
Browse tutorials Free tools