The Last Static Board of the Year
Every rating on this site's 2026 board was written on August 12 and has not moved since. Tomorrow night it moves. New England at Seattle kicks at 20:20 Eastern on Wednesday, September 9, and by roughly midnight two of the thirty-two numbers will be different, the other thirty will not, and the season's arithmetic will have started.
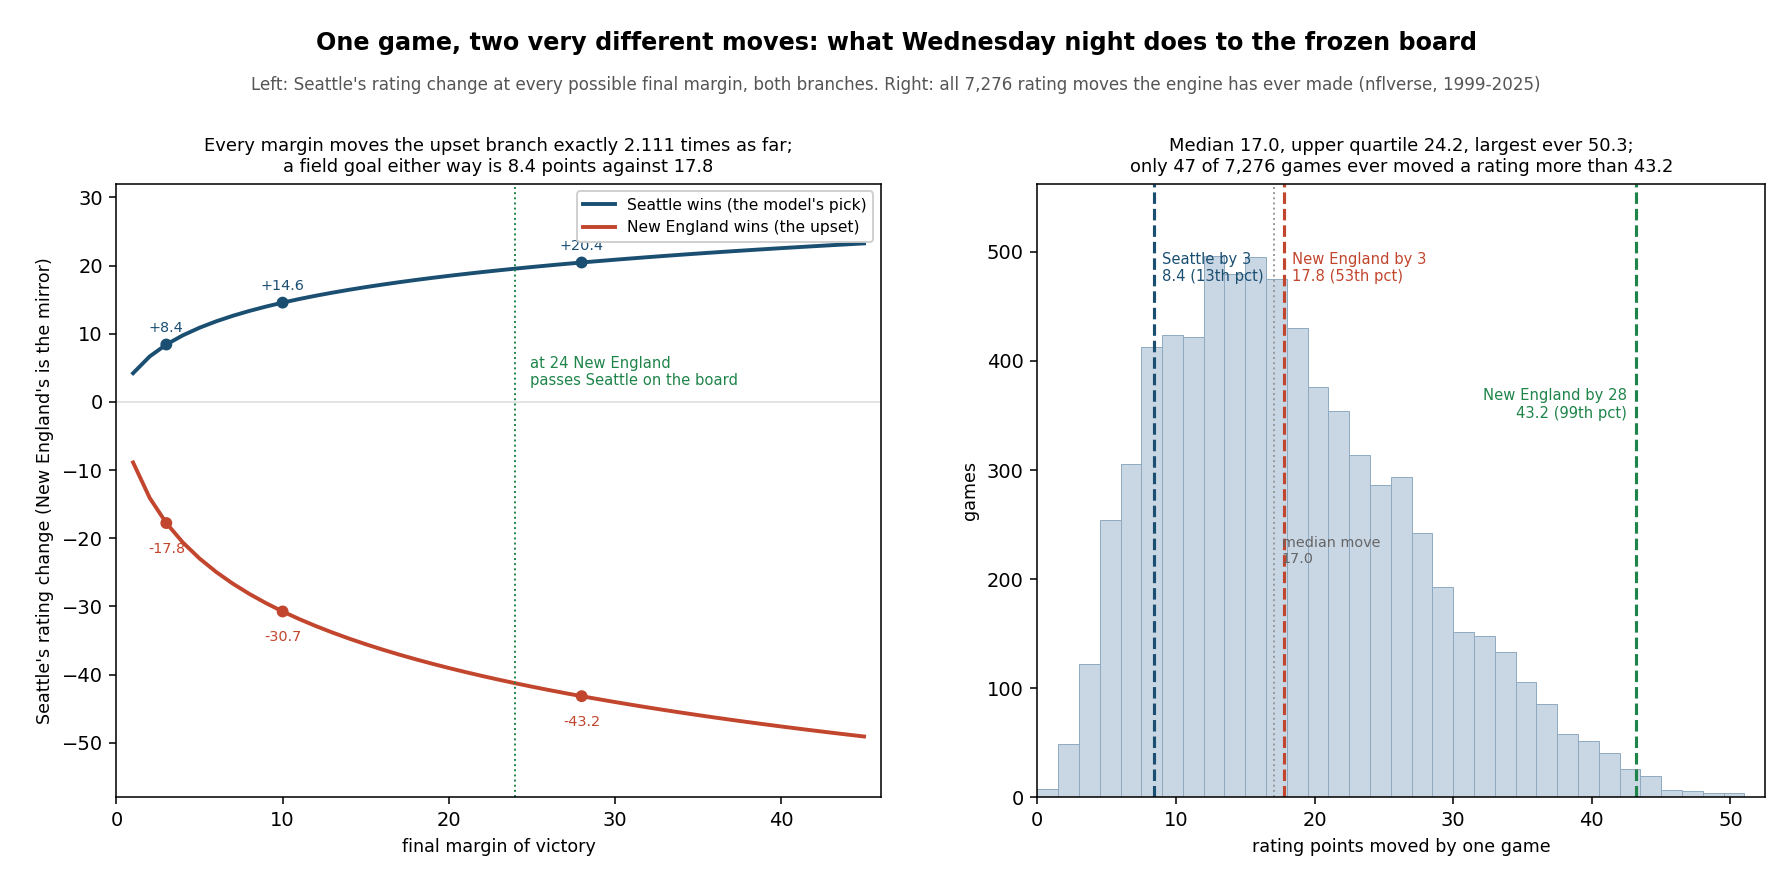
The question worth answering the day before that happens is not who wins. It is how much the answer is worth. And the answer is lopsided in a way most people reading a power rating do not expect: the size of tomorrow's move is set far more by which side wins than by how many points it wins by. A field goal for Seattle is worth 8.4 rating points. The same field goal for New England is worth 17.8 — not because the model cares more about upsets, but because the exchange rate between the two branches is fixed at 2.111, and that number is nothing but the odds the model already published on its own pick.
So this page prices Wednesday night in advance. Every plausible final margin, both branches, the resulting ratings, the margin at which New England would actually pass Seattle at the top of the board, what all of it does to the two teams' week-2 prices, and where the whole range sits inside the 7,276 rating moves this engine has made since 1999. If you are going to grade a model on Monday, it helps to know beforehand how far it can travel.
The Rule, in Full
The engine is the one published in full and it is four lines long. Before the game it prices the home side at
p_home = 1 / (1 + 10 ** (-((rating_home + 48) - rating_away) / 400))Seattle's 1674.6 plus the 48-point home edge against New England's 1592.8 gives an adjusted gap of 129.79 and p = .6785, which is the number frozen in the ledger and repeated on the week-1 predictions page. After the game it moves both ratings by the same amount in opposite directions:
multiplier = log(|margin| + 1) * (2.2 / (0.001 * |adjusted gap| + 2.2))
shift      = 20 * multiplier * (outcome - p_home)      # outcome: 1 win, 0 loss, 0.5 tie
rating_home += shift ; rating_away -= shift
Three things follow, and they are the whole piece. The multiplier depends only on the absolute margin and the absolute gap, so it is identical for a three-point Seattle win and a three-point New England win: 0.944292 times log(4), or 1.309. Everything asymmetric lives in the last term. Seattle winning is worth (1 − .6785) = .3215; New England winning is worth (0 − .6785) = −.6785. Divide one by the other and you get 2.1109, which is exactly the prior odds on Seattle. The model pays for surprise at the price it quoted.
And the multiplier is a logarithm, which flattens hard. Going from a 3-point win to a 28-point win multiplies the margin by nine and the move by only 2.43. Going from a Seattle win to a New England win at the same margin multiplies the move by 2.11. Winning matters roughly as much as the entire range of blowouts.
The Exhibit
Every Margin, Both Ways
| Margin | Seattle wins | SEA | NE | New England wins | SEA | NE |
|---|---|---|---|---|---|---|
| 1 | +4.21 | 1678.8 | 1588.6 | −8.88 | 1665.7 | 1601.7 |
| 3 | +8.42 | 1683.0 | 1584.4 | −17.77 | 1656.8 | 1610.6 |
| 4 | +9.77 | 1684.4 | 1583.0 | −20.62 | 1654.0 | 1613.4 |
| 6 | +11.81 | 1686.4 | 1581.0 | −24.94 | 1649.7 | 1617.7 |
| 7 | +12.62 | 1687.2 | 1580.2 | −26.65 | 1647.9 | 1619.5 |
| 10 | +14.56 | 1689.1 | 1578.2 | −30.73 | 1643.9 | 1623.5 |
| 14 | +16.44 | 1691.0 | 1576.4 | −34.70 | 1639.9 | 1627.5 |
| 17 | +17.55 | 1692.1 | 1575.3 | −37.04 | 1637.5 | 1629.8 |
| 21 | +18.77 | 1693.4 | 1574.0 | −39.61 | 1635.0 | 1632.4 |
| 28 | +20.44 | 1695.0 | 1572.4 | −43.15 | 1631.4 | 1636.0 |
| 35 | +21.76 | 1696.3 | 1571.0 | −45.92 | 1628.7 | 1638.7 |
Read across any row: the right-hand move is 2.111 times the left-hand one, without exception. Read down the left column and the entire range of Seattle outcomes, from a one-point escape to a five-touchdown demolition, is worth 17.5 rating points of variation. Read down the right and New England's range is 37.0. The scoreboard is a volume knob; the winner is the switch.
A tie, which this file has seen 15 times since 1999, costs Seattle 2.34 points and leaves it at 1672.3. That is the smallest move on the board and the only one where a team can lose rating without losing a game.
Twenty-Four Points
Seattle is first on the frozen board and New England is sixth, 81.8 points apart. Because a game moves both ratings by the same amount in opposite directions, closing that gap takes half of it in one direction: a shift of 40.9. Solve the update rule for it and the answer is a New England win by 24.
Worked through: at 23 points the shift is −40.73, which leaves Seattle on 1633.9 and New England on 1633.5 — Seattle still first by four tenths. At 24 the shift is −41.25, Seattle 1633.3, New England 1634.1, and the top of the board has changed hands on the strength of a single September night. That is the whole distance between "an upset" and "a new number one" in this system, and it is worth knowing before anyone writes either sentence.
The outer edges are worth stating too, because they bound everything else. The largest margin the file has ever recorded is 59 points, in week 6 of 2009. If New England produced that tomorrow, Seattle would fall 52.5 points to 1622.1 — still 6.2 clear of Buffalo, which does not play until Sunday — and New England would rise to 1645.3 and the top spot. If Seattle produced it, Seattle would gain only 24.9, to 1699.4. Seattle's entire Wednesday, from the worst result in NFL history to the best, spans 77.3 rating points; New England's spans the same 77.3 the other way. Nothing else on the board can move at all.
What It Buys You in Week 2
Rating points are only interesting when they change a price. Both teams play on September 20: New England hosts Pittsburgh, Seattle visits Arizona. Priced off today's board those games sit at .6723 and .7919 for the two favorites. Here is what Wednesday does to them.
| Wednesday's result | NE rating | NE vs PIT | SEA rating | SEA at ARI |
|---|---|---|---|---|
| No game (today's board) | 1592.8 | .6723 | 1674.6 | .7919 |
| Seattle by 10 | 1578.2 | .6536 | 1689.1 | .8054 |
| Seattle by 3 | 1584.4 | .6615 | 1683.0 | .7998 |
| New England by 3 | 1610.6 | .6944 | 1656.8 | .7746 |
| New England by 10 | 1623.5 | .7100 | 1643.9 | .7613 |
| New England by 24 | 1634.1 | .7223 | 1633.3 | .7501 |
The largest swing available anywhere in that table is 5.0 points of probability for New England and 4.2 for Seattle, and both come from the most extreme result on it. No pick flips; both teams are favored in week 2 in every branch, and would be even if Wednesday went to the far tail. That is the honest scale of one game inside a rating system with K = 20: it moves the price by a few percent, and it moves a pick only when the next matchup was already close to even. It is also why I would not read much into a Thursday-morning power ranking that reshuffles the top five off a single result — this one cannot, by construction, do more than reorder two teams.
Where This Sits Among 7,276 Moves
To know whether tomorrow's range is big, you need the distribution it lives in. I replayed the engine over every played game in the bundled log — taking the between-season regression out first, so what is recorded is the game's own work and not the offseason's — and kept the size of all 7,276 moves.
The median move is 17.05 points and the mean is 18.29. The quartiles are 11.40 and 24.19; the ninetieth percentile is 31.21, the ninety-ninth 41.75. The largest single move in twenty-seven seasons is 50.32, from week 3 of 2008, when Miami won by 25 at New England in a game the model had priced at .9296 for the home side. Second is Denver's 45-point home loss to Oakland in 2010; third is Philadelphia's 28-point week-17 loss to Cincinnati in 2004. The smallest is 0.12.
Against that: a three-point Seattle win is a 13.5th-percentile move, quieter than six games in seven. A three-point New England win is a 53.2nd-percentile move, a completely ordinary Sunday. A 28-point New England win would be a 99.3rd-percentile move, of which the file holds only 47 in 7,276 games. And the theoretical worst case — 59 points — would exceed every move the engine has ever made.
One more number, because it complicates the story slightly in the right direction: openers move ratings more than average, 18.87 against 18.29. That is not the model learning faster in September. It is the arithmetic of a board that has just been pulled a third of the way toward 1505, which leaves probabilities closer to even and therefore surprises larger. The haircut buys the model humility, and humility is expensive to update.
What This Is Not
It is not a forecast of the margin. Everything above is conditional arithmetic: if the game ends here, the board goes there. The probability attached to each row is the model's, and the model reads final scores and nothing else — no injury report, no depth chart, no news from Wednesday afternoon. If New England's quarterback situation changed tonight, the numbers on this page would be exactly as wrong as they were this morning and would not know it.
It is also not a claim that a 28-point win makes New England the sixth-best team turned first. It makes New England the team with the highest number in a system that updates on scores, which is a narrower thing. The margin-of-victory multiplier is deliberately logarithmic precisely because the difference between winning by 24 and winning by 31 is mostly garbage time, and a linear rule would let a late cover rewrite a season. That flattening is a choice, and a defensible one, but it means this system is structurally slow to believe in blowouts and structurally quick to believe in upsets.
Finally, the asymmetry is not evidence of anything. A 2.111 exchange rate says the model was confident, not that it was right to be. The confidence behind it was built entirely on 2025 scores with a third of the deviation removed, which is a thin basis for anything — and sixteen graded seasons say the week-1 board is about as accurate as any other week and merely quieter about it. The move is a measurement of surprise relative to a prior. Whether that prior deserved respect is what the next eighteen weeks are for, and what the miss budget is there to keep honest.
Method and Sources
Two published files: the nflverse game log bundled and served at /data/games.csv, and the frozen ledger at /data/predictions.json. The harness is explainer_src/make_one_game_move_chart.py, which imports nfl_elo rather than copying it, so the arithmetic on this page cannot drift from the engine that will actually do the updating on Wednesday night. The core of it is short enough to print:
import nfl_elo as E

rows = E.load_games()
eng  = E.current_ratings(rows)          # walk forward, then roll into 2026
sea, ne = eng.rating("SEA"), eng.rating("NE")
p = E.expected_home(sea, ne, False)     # .6785, the frozen number

def shift(margin):                      # points added to Seattle
    outcome = 1.0 if margin > 0 else (0.0 if margin < 0 else 0.5)
    wd = (sea + E.HFA) - ne if margin >= 0 else ne - (sea + E.HFA)
    return E.K * E.mov_multiplier(margin, wd) * (outcome - p)

print(shift(3), shift(-3), shift(-3) / shift(3))
# 8.416  -17.765  -2.1109
The published board rounds to a tenth; the engine carries full precision, and this page uses the engine's own values, which is why the frozen 1674.6 reproduces .6785 rather than .6786. The script asserts every figure here — the constants, the frozen row, both branches at eleven margins, the fixed exchange rate, the crossover at 24, the floor and ceiling, both week-2 tables, the full replay distribution with its percentiles and its three largest moves, and the opener-versus-average comparison: 162 assertions, all green as of September 8, 2026.
Sources: the nflverse public game log (1999–2025 results plus the 2026 schedule), bundled at /data/games.csv; ratings and the update rule from explainer_src/nfl_elo.py, the module that writes the live ledger. The rating system itself is Arpad Elo's, set out in The Rating of Chessplayers, Past and Present (Arco, 1978); the margin-of-victory multiplier and the 1/3 preseason regression are this site's own constants, stated in the model page and graded in public.
Further reading
- Our Prediction Model, Fully Stated — where K, the home edge and the multiplier come from, and the sixteen-season backtest behind them
- The Offseason Haircut — why the two ratings on this page start where they do, and why openers move further than average
- The Shortest Lines of the Year — the same night seen from the market's side, and why its number is short
- Opening Night 2026 — the matchup itself, priced
- Nine Games on One Shelf — the sixteen frozen probabilities sorted by how sure the model is
- The Model Gets Louder, Not Smarter — whether a September rating is worse than a December one
- The Miss Budget — how many of these the model expects to get wrong, so one result cannot be a verdict
- Does Week 1 Mean Anything? — the same question asked of records rather than ratings
- The power rankings and the prediction ledger — where these two numbers will have changed by Thursday morning
Your team
Kept in this browser only.
Pick the playoffs
Pick the games left and see both conferences’ seeds under the NFL’s tie-breakers.
Go deeper
Want the code behind these metrics? Work through the 43-chapter NFL analytics tutorial.
Browse tutorials Free tools