Every Team Was Rated Twice This Year
The board this site plays 2026 with was frozen on August 12, and it is not the board the model finished last season holding. Between the two sits one line of code: every rating moves a third of the way back to 1505 before a new season starts. Nobody signed anybody. The engine cannot see a draft, a trade, or a torn hamstring — by design it reads final scores and nothing else — so the single largest change to the 2026 numbers is a change the model made to itself.
It is worth knowing how large. Seattle finished the season the model rates at 1759.4, the ninth-highest end-of-season rating in the 861 the file holds since 1999. It opens 2026 at 1674.6. That is 84.8 points handed back for nothing, the biggest single move on the board, and it is worth 1.21 expected wins across the 2026 schedule. At the other end, Tennessee finished at 1272.1 — the 14th-lowest of those 861 — and opens at 1349.8, 77.7 points richer and 1.16 expected wins better off without playing a down. Seventeen teams gave points back, fifteen received them, and the average team moved 35.3 points.
So this page does two things. It prints the movement team by team, in rating points and in expected wins, and it re-prices the sixteen openers both ways to see what the haircut actually changed. Then it asks the question the movement invites: is a third the right amount? Across 829 team-season pairs the file says teams keep .634 of their January deviation into the following January, against the .667 the engine assumes — close enough that the difference is 1.2 standard errors of nothing. With one exception, and the exception is not the one people expect.
What a Uniform Shrink Can and Cannot Do
The operation is new = old × 2/3 + 1505 × 1/3, applied to all 32 ratings at once. Three consequences follow from the arithmetic alone, and they matter for reading the table below.
It cannot re-rank anyone. The order of the 32 in January and the order on the frozen board are identical, top to bottom. Any 2026 ranking surprise — Kansas City seventeenth, Tennessee last — was already true in February; the regression only made it quieter. It is zero-sum. Both boards average exactly 1505, so the points Seattle gave back are the points Tennessee, Las Vegas and the Jets received. And it is proportional to distance: Kansas City finished at 1509.8, four and a half points from average, and moved 1.6. Pittsburgh moved 5.5, Tampa Bay 8.3. The middle of the board is untouched because there is nothing to take.
What the shrink does change is spread. The board's span fell from 487.2 rating points between best and worst to 324.8; its standard deviation fell from 124.8 to 83.2. Priced across the actual 2026 schedule, the expected-win gap between the best and worst team fell from 9.68 wins to 7.30 — the 7.3 that the win-totals page reports, arrived at from the other side. Two cross-checks anchor everything here: the rolled January ratings reproduce all 32 frozen values to the published tenth, and pricing the 272-game schedule with them reproduces the win-totals page exactly (Seattle 12.17, Houston 11.06, Las Vegas 4.87).
The Exhibit
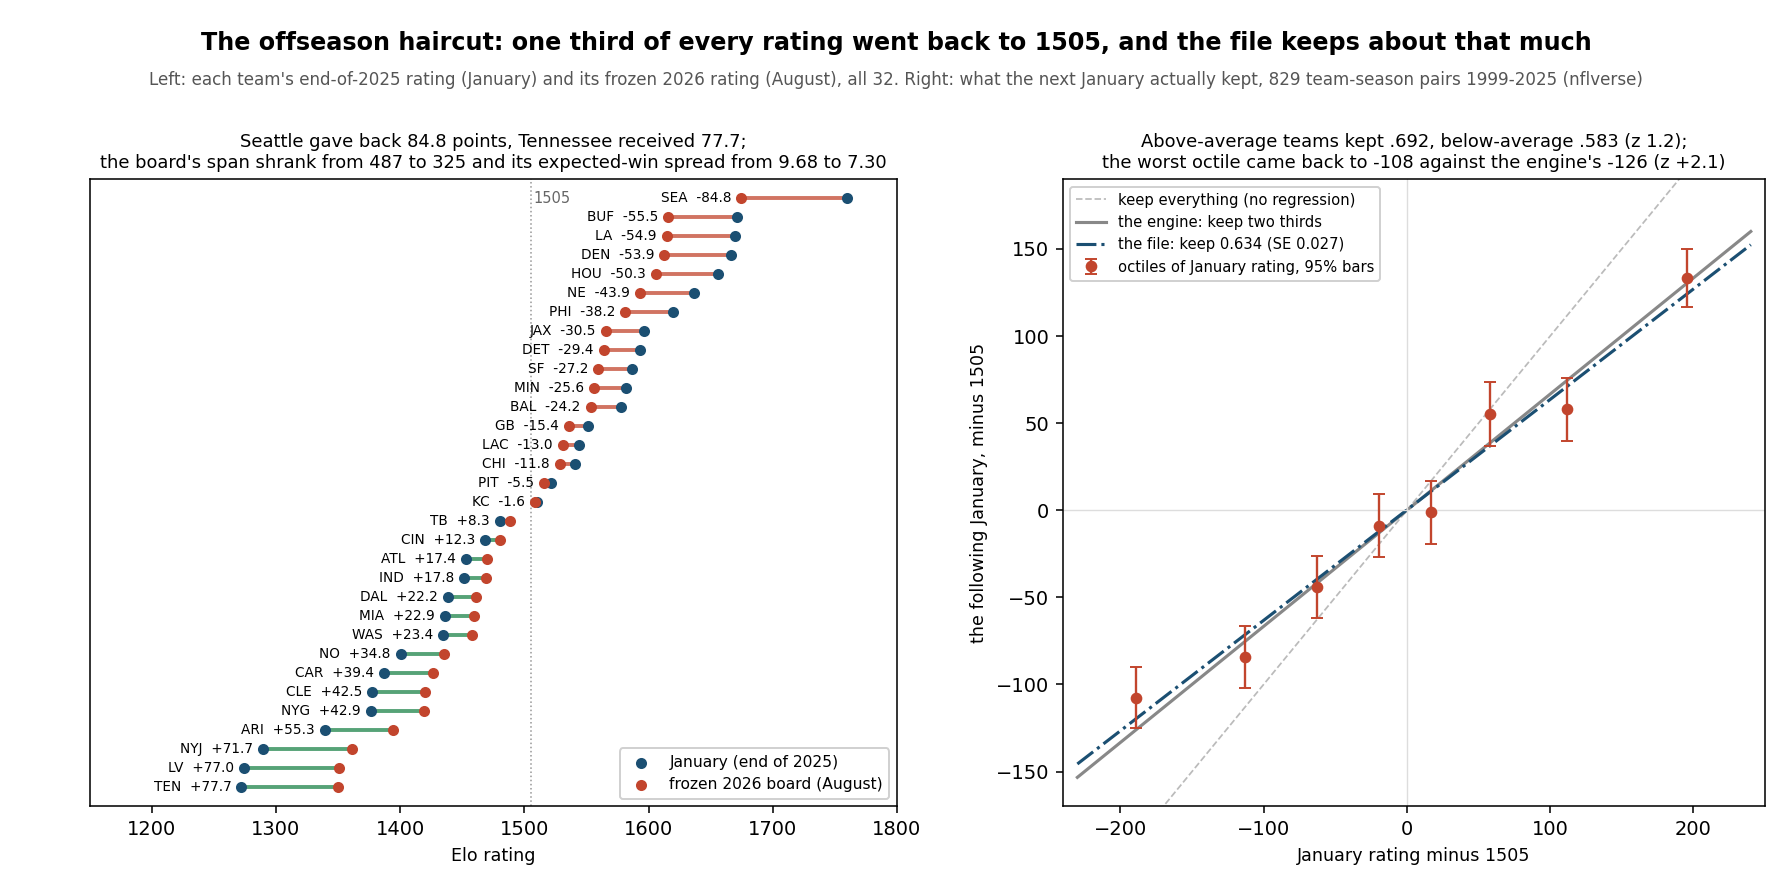
All Thirty-Two, January to August
| Team | January | Frozen | Move | Exp. wins, January | Exp. wins, frozen | Change |
|---|---|---|---|---|---|---|
| SEA | 1759.4 | 1674.6 | −84.8 | 13.38 | 12.17 | −1.21 |
| BUF | 1671.4 | 1615.9 | −55.5 | 11.45 | 10.63 | −0.83 |
| LA | 1669.6 | 1614.7 | −54.9 | 11.41 | 10.62 | −0.79 |
| DEN | 1666.5 | 1612.6 | −53.9 | 11.76 | 10.86 | −0.90 |
| HOU | 1655.9 | 1605.6 | −50.3 | 12.06 | 11.06 | −1.00 |
| NE | 1636.7 | 1592.8 | −43.9 | 10.72 | 10.12 | −0.61 |
| PHI | 1619.4 | 1581.2 | −38.2 | 11.37 | 10.57 | −0.80 |
| JAX | 1596.4 | 1565.9 | −30.5 | 10.49 | 9.88 | −0.61 |
| DET | 1593.3 | 1563.9 | −29.4 | 10.94 | 10.24 | −0.70 |
| SF | 1586.6 | 1559.4 | −27.2 | 9.89 | 9.52 | −0.37 |
| MIN | 1581.7 | 1556.1 | −25.6 | 10.30 | 9.80 | −0.50 |
| BAL | 1577.6 | 1553.4 | −24.2 | 10.73 | 10.06 | −0.67 |
| GB | 1551.3 | 1535.9 | −15.4 | 9.10 | 8.95 | −0.15 |
| LAC | 1543.9 | 1530.9 | −13.0 | 8.63 | 8.61 | −0.02 |
| CHI | 1540.5 | 1528.7 | −11.8 | 8.55 | 8.57 | +0.01 |
| PIT | 1521.5 | 1516.0 | −5.5 | 9.02 | 8.87 | −0.15 |
| KC | 1509.8 | 1508.2 | −1.6 | 8.33 | 8.37 | +0.04 |
| TB | 1480.1 | 1488.4 | +8.3 | 8.32 | 8.40 | +0.08 |
| CIN | 1468.1 | 1480.4 | +12.3 | 8.40 | 8.43 | +0.03 |
| ATL | 1452.9 | 1470.3 | +17.4 | 7.71 | 7.96 | +0.25 |
| IND | 1451.6 | 1469.4 | +17.8 | 7.58 | 7.86 | +0.28 |
| DAL | 1438.5 | 1460.7 | +22.2 | 6.86 | 7.33 | +0.47 |
| MIA | 1436.2 | 1459.1 | +22.9 | 6.47 | 7.05 | +0.58 |
| WAS | 1434.8 | 1458.2 | +23.4 | 6.85 | 7.32 | +0.47 |
| NO | 1400.5 | 1435.3 | +34.8 | 7.13 | 7.56 | +0.42 |
| CAR | 1386.9 | 1426.3 | +39.4 | 5.56 | 6.44 | +0.89 |
| CLE | 1377.4 | 1419.9 | +42.5 | 6.69 | 7.21 | +0.52 |
| NYG | 1376.4 | 1419.3 | +42.9 | 5.89 | 6.62 | +0.73 |
| ARI | 1339.1 | 1394.4 | +55.3 | 4.60 | 5.64 | +1.04 |
| NYJ | 1289.8 | 1361.5 | +71.7 | 4.06 | 5.19 | +1.13 |
| LV | 1274.0 | 1351.0 | +77.0 | 3.70 | 4.87 | +1.17 |
| TEN | 1272.1 | 1349.8 | +77.7 | 4.07 | 5.23 | +1.16 |
January = the rating after the last played game of the 2025 season. Frozen = the ledger's opening 2026 rating. Expected wins price the team's actual 17-game 2026 schedule with each board (48-point home edge, waived at the three neutral sites); both columns sum to 272.
The expected-win column is where the haircut stops being an abstraction. It bought Las Vegas 1.17 wins, Tennessee 1.16, the Jets 1.13 and Arizona 1.04, and it charged Seattle 1.21, Houston 1.00, Denver 0.90 and Buffalo 0.83. Every team rated above 1550 in January is worse off on the frozen board and every team below 1450 is better off; in the 1450-to-1550 band the sign depends on the schedule as much as the rating, because who a team plays decides whether a softened league helps or hurts. The Chargers moved 13 rating points and lost 0.02 expected wins; Chicago moved 11.8 and gained 0.01. In the middle of the board the whole operation is invisible.
The Sixteen Openers, Priced Both Ways
Run the week-1 board through the January ratings and the sixteen picks come back almost unchanged. Exactly one flips: Dallas at the Giants, which the January board calls Dallas at 52.0% and the frozen board calls the Giants at 51.0%. The mechanism is visible in one line — Dallas was 62.0 rating points better in January and is 41.4 better now, and the home edge is a flat 48 either way. The haircut walked the Cowboys' edge past the field-advantage line. It is also worth what it looks like: 1.1 points of conviction, on the closest game of the week.
Everything else moves in magnitude only, and mostly downward. Mean stated confidence across the sixteen falls from .6609 to .6196, which is 10.57 expected correct against 9.91 — the published grading frame is two thirds of a game quieter than it would have been in February. Jacksonville over Cleveland would have been a .823 pick and is .753. Seattle over New England would have been .728 and is .679, the rating gap having fallen from 122.7 to 81.8. The two loudest disagreements with the market both shrank: Miami at Las Vegas from .659 to .586, Denver at Kansas City from .652 to .581.
Three games went the other way, and they are the interesting ones. Buffalo at Houston got louder (.5467 to .5540), as did the Jets at Tennessee (.5435 to .5519) and Tampa Bay at Cincinnati (.5517 to .5573). These are exactly the three games where the visitor is rated higher but the host is favored anyway, and the reason is structural: the home edge is a constant, the rating gap it has to overcome is not. Shrink the gap and the fixed 48 does proportionally more work. In other words, regression does not simply mute the board — it mutes the teams and leaves home field alone, so games decided by home field get more confident, not less.
Is a Third the Right Number?
The engine's constant is an assumption, and the file it runs on can grade it. Take every team's end-of-season rating and the same team's rating the following January — 829 pairs from 1999 through 2025 — and regress one deviation on the other. The fitted line keeps .634 of a January deviation (SE .027, correlation .629), with an intercept indistinguishable from zero. The engine keeps .667. The difference is 1.2 standard errors: on this evidence, one third is right, or at any rate not wrong in a way 829 team-seasons can detect.
The averages hide two asymmetries. Split the sample at 1505 and above-average teams kept .692 of their deviation (SE .066) while below-average teams kept .583 (SE .067) — good teams are stickier than bad ones, though at z = 1.16 that is a suggestion, not a finding. Sorted into octiles, seven of the eight sit within two standard errors of the engine's line and one does not: the worst octile, teams averaging 189.0 points below the mean in January, came back to −107.7 the following January when the engine would have priced them at −126.0. That is z = +2.07, and it points the same way as the split above. The very bad teams in this file recovered faster than a flat one-third rule expects, which is the one place a 2026 reader should discount the board: Tennessee, Las Vegas and the Jets may be underrated even after being handed 70-plus points each.
Year to year the fraction is unstable enough to warn against precision. Fitting each offseason separately, survival ranges from .479 into 2001 to .882 into 2009, median .627, with 18 of 26 seasons below the engine's two thirds. Into 2025 it was .548. A single offseason is 32 noisy points; the constant is a long-run compromise and behaves like one.
The comparables make the same point in plain language. Sixteen team-seasons in the file finished January rated between 1730 and 1800, as Seattle nearly did. Their next January averaged 1689.0, above the 1671.4 the engine's regression assigned them; they won at a .698 clip and 13 of 16 made the playoffs. Only one was rated higher a year later (New England after 2003), and the worst case is a warning: the 2001 Rams fell from 1740.7 to 1546.9 and went 7–9. The 26 teams that finished between 1250 and 1300, the Tennessee band, came back to 1363.7 against the engine's 1352.9, won at .362, and sent five of 26 to the playoffs — with the 2008 Dolphins (1298.3 to 1501.5, 11–5) at one extreme and Cleveland's 0–16 at the other.
Two Ways to Score the Fraction
A slope is one test. The better test is predictive, and there are two honest versions of it. The first freezes a January board, shrinks it by some fraction, and uses it to predict every regular-season game of the following year — 6,704 decided games from 2000 to 2025, no updating at all, which is the closest thing to what the 2026 board is being asked to do in September:
| Regression toward 1505 | Static: accuracy | Static: Brier | Walk-forward: accuracy | Walk-forward: Brier |
|---|---|---|---|---|
| none | .5984 | .2423 | .6361 | .2295 |
| one sixth | .5995 | .2381 | .6411 | .2232 |
| one quarter | .6013 | .2365 | .6451 | .2215 |
| one third (this model) | .6035 | .2352 | .6469 | .2205 |
| one half | .6041 | .2340 | .6451 | .2199 |
| two thirds | .5989 | .2351 | .6384 | .2207 |
| everything (all teams 1505) | .5604 | .2458 | .6239 | .2256 |
Static: a January board, shrunk once, predicting all 6,704 decided regular-season games of the following season, 2000–2025. Walk-forward: the full engine re-run with that constant, graded on the published window (4,350 decided games, 2010–2025). Lower Brier is better; .25 is a coin flip.
Both columns say the same thing twice. Some regression is worth a lot: going from none to a third buys .0071 of Brier and half a point of accuracy in the static test — 34 more correct picks out of 6,704 — and .0090 of Brier walking forward. Beyond that the curve is nearly flat and the optimum is soft. The static test likes one half best by both scores; the walk-forward run gives its best accuracy to one third (.6469, the site's published number) and its best Brier to one half, by .0006. Anywhere between a quarter and a half is defensible, and the site's constant sits inside that band. Full regression — throwing away last season entirely and picking the home team — is meaningfully worse, which is the only strong conclusion available here.
Worked Example: Where Seattle's 84.8 Points Went
Seattle ended the season at 1759.4, which is 254.4 points above the 1505 baseline. A third of 254.4 is 84.8, so the frozen rating is 1759.4 − 84.8 = 1674.6, the number on the ledger. Now the opener, Wednesday against New England. The Patriots ended at 1636.7 and open at 1592.8, so the gap Seattle carries into its own stadium fell from 122.7 to 81.8. Add the 48-point home edge and run the logistic: 1 / (1 + 10−170.7/400) = .7276 on January ratings, 1 / (1 + 10−129.8/400) = .6785 on the frozen board. Same two teams, same field, 4.9 points of confidence removed by a constant.
Across the full schedule the same shrink costs Seattle 1.21 expected wins, from 13.38 down to 12.17. To get its 84.8 points back on the field, at K = 20 and a typical margin multiplier, the Seahawks need a season of beating the model's expectations — which, if they are the team January thought they were, is exactly what they will do, and the ratings will say so by November. That is the trade the regression makes: it is deliberately wrong about the best team in order to be less wrong about the other 31.
What This Page Cannot Tell You
- This is not an offseason review. The move column measures one line of arithmetic, not roster churn. A team that rebuilt its line and a team that lost nobody get the identical treatment; the engine is blind to both, and any team whose true strength changed since February is mispriced here in a way this page cannot detect.
- The 829 pairs mix eras and formats. They span 16-game and 17-game seasons, two playoff structures, and 2020. The survival slope is an average over all of it, and its per-season range (.479 to .882) is wider than the gap between any two of the constants tested above.
- The static test is not the model. It freezes a board for a whole season, which no version of this engine ever does. It is included because it isolates the regression choice from in-season updating; the walk-forward column is the honest one for grading the live model.
- A flat fraction is itself an assumption. The worst-octile result (z = +2.07) and the above-versus-below split hint that the right rule is asymmetric, or that it should depend on how a rating was earned. Testing that properly needs more than eight octiles of 104 seasons, and this page does not claim to have done it.
- Expected wins are not a forecast. The two expected-win columns price the same schedule with two boards; neither predicts anyone's record. The binomial noise on a 17-game season is roughly two wins, larger than every number in the change column.
- The three "louder" openers are a rounding-scale effect. Their gains are 0.6 to 0.8 points of probability. They are reported because the mechanism is real and instructive, not because anything hinges on them.
Reproduce It
Two published files: games.csv from nflverse nfldata, bundled at /data/games.csv, and the frozen ledger at /data/predictions.json. The harness is explainer_src/make_offseason_haircut_chart.py, which imports the live engine rather than copying it, and its January-to-August half is short enough to print:
import json, nfl_elo as E

rows, eng, jan, last = E.load_games(), E.Engine(), {}, None
for r in rows:                       # walk forward through every played game
    if not E.played(r):
        continue
    s = int(r["season"])
    if last is not None and s != last:
        jan[last] = dict(eng.r)      # the ratings as the season ended
    eng.predict(r)                   # rolls the season (regression) before feeding
    eng.feed(r)
    last = s
jan[last] = dict(eng.r)

frozen = json.load(open("static/data/predictions.json"))["ratings"]
for t in sorted(jan[2025], key=jan[2025].get, reverse=True):
    print(t, round(jan[2025][t], 1), frozen[t], round(frozen[t] - round(jan[2025][t], 1), 1))
# SEA 1759.4 1674.6 -84.8 ... KC 1509.8 1508.2 -1.6 ... TEN 1272.1 1349.8 +77.7
The script asserts every figure on this page — the replay against the published backtest, all 32 January ratings and moves, the expected-win pricing against the win-totals page, the sixteen openers priced both ways including the single flip and the three that got louder, the 829-pair regression with its standard errors and splits, the eight octiles, the per-season range, the three comparable bands, and both scoring tables at seven regression fractions: 151 assertions, all green as of September 7, 2026.
Sources: the nflverse public game log (1999–2025 results plus the 2026 schedule), bundled and served at /data/games.csv; ratings, pricing and the regression constant from explainer_src/nfl_elo.py, the module that writes the live ledger. The statistical idea being applied — that a set of noisy estimates does better when each is pulled toward the group mean — is the shrinkage result popularised for general readers by Bradley Efron and Carl Morris, "Stein's Paradox in Statistics" (Scientific American, 1977); the one-third here is this site's own constant, graded above rather than borrowed.
Further reading
- The Model, Fully Stated — where the one-third constant lives, and the 16-season backtest this page re-runs at six other values
- Kansas City Is 17th — the same haircut applied a year earlier, when it took 66.2 points off the Chiefs before the collapse took 127.7 more
- Elo-Implied 2026 Win Totals — the frozen column of the table above, summed and ranked; this page supplies the counterfactual
- Nine Games on One Shelf — why the 2026 openers cluster so tightly, which the haircut is largely responsible for
- The First Four Games, Priced — the same frozen ratings pointed at the opening month
- Does the Preseason Mean Anything? — the reason nothing between February and September touches these numbers
- Close-Game Luck and Pythagorean Wins — the two pages on why last season's record deserves shrinking in the first place
- The power rankings and the prediction ledger — the frozen board in its two live homes, updated as games grade
Your team
Kept in this browser only.
Pick the playoffs
Pick the games left and see both conferences’ seeds under the NFL’s tie-breakers.
Go deeper
Want the code behind these metrics? Work through the 43-chapter NFL analytics tutorial.
Browse tutorials Free tools