Two Pricers, One Bad Week
There are two independent forecasts of NFL games in the files behind this site. One is the betting market's closing spread, bundled with the game log going back to 1999. The other is this site's own Elo, which reads nothing but final scores and has never seen a line. They share no inputs, no method and no incentives. They post their worst week of the season in the same week.
The market's mean absolute error against the closing number peaks in week 10, at 10.97 points across 384 games, against 10.26 for the file as a whole and 9.27 in week 11. The model's straight-up accuracy bottoms out in week 10 too, at .5856 on 222 decided games, against .6458 across sixteen backtested seasons and .7059 in its best week. Two forecasters that agree on nothing agree that the second Sunday of November is the hardest day of the year to price.
That is the kind of coincidence that gets a name and a mechanism attached to it within about a paragraph. The trade deadline just passed. Injuries have piled up. It is the peak bye week. Teams are quitting or waking up. Every one of those stories is available and none of them is needed, because the finding does not survive its first honest test. Shuffle the week labels at random twenty thousand times and the worst week of a purely random calendar is at least as bad as week 10 65% of the time. There is no week 10 problem. There is an eighteen-looks problem, and it is worth understanding on the day a season starts, because you are about to be handed eighteen chances to find a pattern in this model that is not there.
How I Measured It
Two samples, because the two forecasters cover different spans. The market sample is every regular-season game in the bundled nflverse log that carries both a closing spread and a final score: 6,967 games across 27 complete seasons, 1999 through 2025. Its error is the home margin minus spread_line, which is positive when the home team is favoured; the summary statistic is mean absolute error, in points.
The model sample comes from replaying the published engine over the same file — walk-forward Elo, K = 20, home field +48, a margin multiplier, one-third regression between seasons — and grading from 2010 after an eleven-season burn-in, exactly as the backtest does. That is 4,175 regular-season games, 4,162 of them decided. The harness imports the engine rather than reimplementing it, so the numbers here cannot drift from the model they describe. Both series are cut by week of the regular season, weeks 1 through 18, with no gaps.
Nothing in this page has been graded from 2026. The file holds all 272 rows of this season's schedule and not one score; the opener kicks tonight. Every figure below is history, and the only forward-looking section is a simulation clearly labelled as one.
The Exhibit
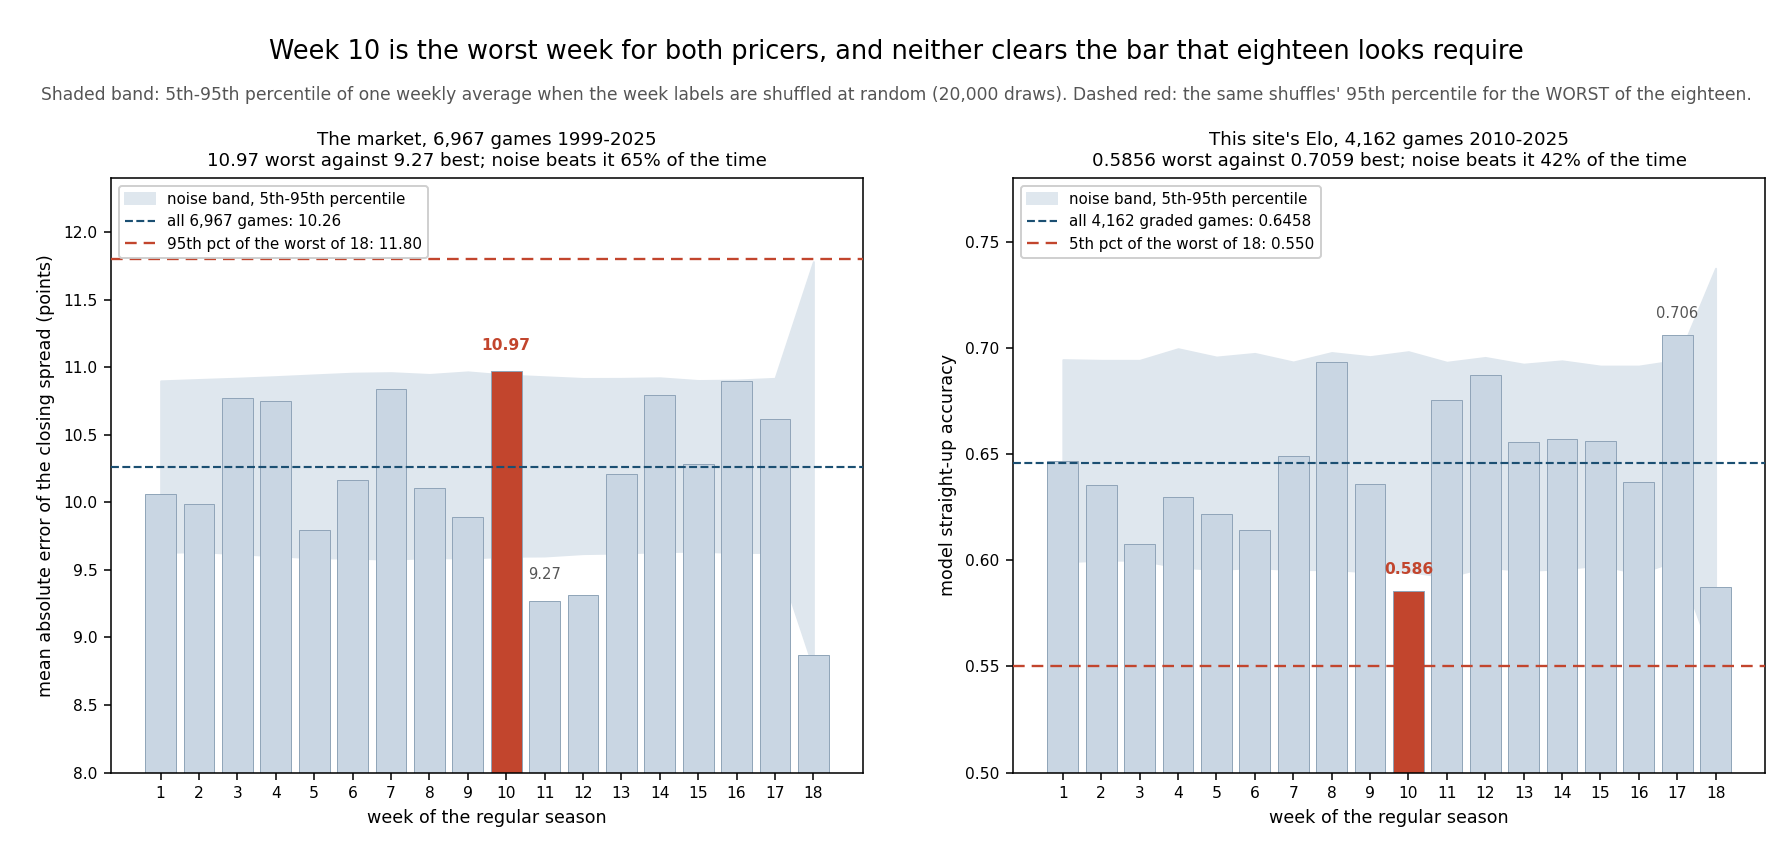
The Arithmetic of Looking Eighteen Times
Start with the naive test, the one that makes week 10 look real. Week 10's games miss by 0.748 points more than the other 6,583 games in the file, with a standard error of 0.450 — 1.66 standard errors, which does not clear two but is close enough to be interesting. On the model side, week 10's .5856 sits 1.79 standard errors below the engine's own .6458. Two near-misses at two sigma, pointing the same way, in the same week. If either had arrived as a pre-registered hypothesis I would be writing a different page.
Neither did. Week 10 was selected because it was the extreme, and the correct null hypothesis is not "this week is average" but "the worst of eighteen weeks is this bad". So I built that null directly rather than reaching for a correction formula. Take the 6,967 absolute errors, shuffle them, deal them back into buckets of the real weekly sizes, and record the worst bucket. Twenty thousand times, with a fixed seed.
| Test | Observed | Median under noise | 5% / 95% tail | p |
|---|---|---|---|---|
| Market: worst weekly MAE | 10.97 | 11.06 | 11.80 | .645 |
| Model: worst weekly accuracy | .5856 | .5877 | .5500 | .423 |
| Both worst weeks land in the same week | yes | — | — | .111 |
| Market: spread across all 18 weeks (χ², 17 df) | 29.01 | 16.40 | 27.74 | .036 |
| Model: spread across all 18 weeks (χ², 17 df) | 17.81 | 16.20 | 27.69 | .396 |
Read the first two rows and the story ends. The median random calendar produces a worst week of 11.06 points — worse than the real week 10 — and the model's median random worst week is .5877, a hair worse than the real .5856. To be surprising, week 10 would have to reach 11.80 on the market side or fall to .550 on the model side. It does neither. The two most extreme numbers in a season-long file are almost exactly what you get from dealing football randomly into eighteen piles.
The third row is the one I expected to be the interesting one, since two independent forecasters agreeing on the worst week feels like it must mean something. Shuffling both series together — same games, same labels, so whatever correlation exists between the two is preserved — the market's worst week and the model's worst week land on the same week 11.1% of the time, against the 5.6% you would get from pure independence. The coincidence is roughly twice as likely as it looks, and it was never unlikely to begin with. One-in-nine events happen constantly.
Is It the Same Week Every Year? No.
A structural effect should show up season by season, not only in the pool. It does not. Compare each season's week 10 with that same season's own average error, and week 10 comes out worse in 15 of 27 seasons — one more than a coin would give you. The average excess is +0.70 points with a standard error of 0.48, a t of 1.46.
Better, look at where the pooled excess comes from. Five seasons account for all of it:
| Season | Week 10 MAE | That season's MAE | Excess |
|---|---|---|---|
| 2021 | 18.54 | 10.78 | +7.75 |
| 2011 | 15.25 | 10.47 | +4.78 |
| 2018 | 14.68 | 9.98 | +4.70 |
| 2012 | 15.25 | 10.87 | +4.38 |
| 2015 | 14.25 | 10.13 | +4.12 |
| The other 22 seasons | — | — | −0.31 |
Delete those five and week 10 is 0.31 points better than its own seasons, not worse. The largest single contribution is 2021, when fourteen week-10 games missed the number by an average of 18.5 points; the largest in the other direction is 2009, whose week 10 ran 3.71 points better than its season. A "structural" effect that lives in five seasons out of twenty-seven and reverses in the other twenty-two is a run of bad Sundays with a label on it.
The ownership count says the same thing from another angle. Ask which week was the worst in each individual season and fourteen different weeks have held the title at least once. Week 10 owns four of the twenty-seven, against the 1.5 chance would hand it. No week has more than four. If November were genuinely unpriceable you would expect a monopoly, and there is not one.
The Two Explanations That Run Backwards
The reason I ran this at all is that week 10 has a genuinely distinctive schedule, so the mechanism was sitting right there. It is the peak bye week in the file: 34.4% of week-10 games involve a team on ten or more days of rest, the highest share of any week, against zero in week 1. It is also unusually divisional, at 41.7% against about a third in the surrounding weeks. Both are real features of the calendar. Neither does what the story needs.
Games with a rested team miss the number by 9.87 points, against 10.36 for everything else. Rest makes a game easier to price, not harder — which is not surprising once you say it out loud, because a bye is the single most predictable thing on a schedule and the market has priced fourteen hundred of them. Division games miss by 10.01 against 10.42. Both candidate mechanisms point the wrong way.
The cleanest version of that is inside week 10 itself. Split its 384 games:
| Week 10 games | Games | Mean abs. error |
|---|---|---|
| At least one team on 10+ days of rest | 132 | 10.27 |
| Everyone on a normal week | 252 | 11.34 |
| All of week 10 | 384 | 10.97 |
The bye games are the calm third of week 10. The chaos is entirely in the games where nobody rested, which is the exact opposite of the explanation you would have written down first. Whatever noise week 10 carries, it is not carrying it because of byes.
For completeness, since the rest angle is the one people bet: across the 1,290 games in which exactly one side came in on ten-plus days against an opponent on a normal week, the rested side beat the number by 0.50 points, standard error 0.35, and covered 50.95%. Break-even at standard juice is 52.38%. The rested team is worth something on the scoreboard — the rest page puts a big rest edge at roughly a field goal of margin — and the market has already charged you for it.
Where the Two Pricers Do Agree
The weekly coincidence is noise. The game-level agreement is not, and it is the part of this worth keeping. Take the 4,162 games both forecasters saw and sort them by how badly the market missed:
- In the 1,447 games that finished within five points of the closing number, the model got the winner wrong 20.2% of the time.
- In the 960 games that missed the number by more than fifteen, it got the winner wrong 42.9% of the time.
More than double. When football surprises the market it surprises the model, because the surprise is in the football, not in either forecaster's method. That is also why the two worst weeks coincide more often than independence predicts — 11.1% rather than 5.6% — and why the coincidence still carries no information. Across the eighteen weekly buckets the two error series correlate at just −0.25: the shared shocks are game-sized, and averaging fourteen games washes most of them out before the weekly number is formed.
What Actually Survives
Not everything on the calendar is noise, and I want to be careful not to over-sell a null. The dispersion test in the table above — one chi-square across all eighteen weekly means rather than a spotlight on the extreme — comes back at 29.01 on 17 degrees of freedom for the market, which the same shuffles put at p = .036. The market's weekly averages really do vary more than random dealing explains. The model's do not: 17.81 on 17 df, p = .40, which is a textbook picture of nothing.
So the market has some weekly structure. It is just not located in week 10, and the parts of it I can name are the ends of the calendar rather than the middle. Week 18 is the obvious one: eighty games, the shortest error in the file at 8.87, and home teams finishing 2.23 points above the number, which is what a week of resting starters and unequal motivation looks like. Week 1 is the other, and it has its own page — the shortest numbers of the year, priced with deliberate caution.
Week 10's one genuinely distinctive number is not its error size but its sign. Home teams finish 1.22 points below the closing number in week 10, the most negative bias of any week, against +0.07 across the whole file. It is the same magnitude of thing as the totals result I reported and declined to call a finding in week 1, and it deserves the same treatment: I tested eighteen weeks, one of them had to be the most negative, and this one was. Reported, not believed.
A Season That Starts Tonight
Here is the practical version, and the reason this page runs before kickoff rather than in November. The 2026 schedule in the file is 272 regular-season games in eighteen weeks, thirteen to sixteen a week. The model's long-run rate is .6458. Simulate that season twenty thousand times — every game an independent coin at .6458, no skill variation at all, the friendliest possible world for the model — and ask what the season's worst week looks like.
| A 2026 season of pure .6458 coins | Result |
|---|---|
| Median worst week of the season | .4286 (6 of 14) |
| Seasons with at least one losing week | 80% |
| Seasons with a week at .400 or worse | 42% |
| Median best week of the season | .8571 (12 of 14) |
| Median gap, best week to worst | 43.8 points |
Work one week by hand. A fourteen-game week at .6458 has a standard deviation of √(.6458 × .3542 / 14) = 12.78 points of accuracy; a fifteen-game week, 12.35. Two standard deviations light is .390 — five or six wins out of fourteen. The simulation says the typical season's worst week is exactly 6-and-8, that four seasons in five contain a losing week, and that two in five contain a week at .400 or worse. A 6-and-8 week is not a broken model. It is a Sunday.
Which is the discipline I am pre-committing to for this season, in public, before there is a single result to argue about. The ledger will have bad weeks. Somewhere around November one of them will land in a week that already has a story attached — a bye-heavy week, a trade-deadline week, a cold week — and the story will fit, because stories always fit after the fact. The miss budget is the season-level version of the same commitment: 99 expected misses, published in advance, so that the eightieth one is not news. The learning-curve page made the point for opening weekend specifically. This one makes it for the other seventeen.
The only weekly result that would actually mean something is one that clears the bar the search implies rather than the bar a single test implies: for the market, a week past 11.80 points of error; for the model, a week under .550. Those are the numbers in the exhibit's dashed lines, and I have written them down before the season rather than after it.
What This Page Does Not Show
A null is not a zero. Week 10 running 0.75 points worse than the rest of the calendar is entirely consistent with a small real effect that this file cannot resolve. The 95% interval on that gap runs from −0.13 to +1.63 points. What is ruled out is the large, clean, mechanism-shaped effect the coincidence invites you to believe in.
The two samples are not the same span. The market series runs 1999–2025 and the model series 2010–2025, because the engine needs its burn-in. Restricting the market to the model's window makes week 10 look worse, not better — 11.65 points against 10.08 for the common window — and the permutation logic is unchanged, but the two headline numbers in the first paragraph are not measured over identical games.
Mean absolute error is one loss function. A week could be perfectly ordinary by MAE and pathological in the tails, and this page would not see it. The model side has the same limitation twice over: straight-up accuracy throws away the size of the probability, which is why the Brier column exists in the harness — week 10's .2537 is also the worst of the seventeen full weeks, and week 18's .2626 is worse still.
Byes are approximated by rest days. I classify a team as rested at ten or more days in the home_rest/away_rest fields, which catches byes and also catches a few Thursday-to-Sunday-plus-a-week oddities. It does not distinguish a bye from a scheduling quirk of the same length, and the file gives no explicit bye flag.
The dispersion result deserves its own study. I report p = .036 for the market's weekly spread and then explain it with week 18 and week 1, which is exactly the kind of after-the-fact story this page exists to warn about. I believe the week-18 mechanism because it is pre-registered by the structure of the schedule — resting starters is a known, dated rule change — and I am flagging the rest as unfinished.
Nothing here forecasts 2026. The simulation assumes the model's historical rate and independent games. Real weeks are correlated through injuries, weather and the schedule, so real seasons scatter a little more than the table says, which only strengthens the conclusion.
Method and Sources
One published file, the nflverse game log, served at /data/games.csv, plus a replay of the engine at explainer_src/nfl_elo.py. The harness is explainer_src/make_week10_chart.py. The permutation is six lines:
abs_err = [abs(margin(r) - spread(r)) for r in games]      # 6,967 values
sizes   = [len(by_week[w]) for w in range(1, 19)]          # real weekly counts
rng     = np.random.default_rng(20260909)
worst   = [np.add.reduceat(rng.permutation(abs_err), edges).__truediv__(sizes).max()
           for _ in range(20000)]
p = np.mean(np.array(worst) >= 10.970)                     # 0.645
The script asserts every figure on this page — the file counts, the eighteen weekly averages on both sides, the two-sample tests, all five permutation results with their medians and tails, the season-by-season persistence table, the bye and division splits, the game-level linkage, and the 2026 simulation: 137 assertions, all green as of September 9, 2026. It is pinned to the pre-kickoff dataset (7,548 rows, 7,276 played, no 2026 results) and is meant to fail once tonight's game grades; the page is dated and does not move.
Sources: the nflverse public game log (games.csv, 1999–2025 results and closing numbers plus the 2026 schedule), bundled at /data/games.csv. The randomization test used throughout is R. A. Fisher's, from The Design of Experiments (1935); the multiplicity problem it is used to solve here — that the extreme of many comparisons needs a different null than any one comparison — is the subject of Rupert Miller's Simultaneous Statistical Inference (1966).
Further reading
- The Model Gets Louder, Not Smarter — the by-week accuracy series this page stress-tests, and where the .5856 first appeared as a one-line curiosity
- The Shortest Lines of the Year — the weekly structure that does survive, measured on the market's numbers
- How Accurate Is the Point Spread? — the whole-file version of the error column, and the unbiasedness result week 10 briefly appears to dent
- Does Rest Matter in the NFL? — what a bye is worth on the scoreboard, as against what it is worth at the window
- The Miss Budget — 99 misses published in advance, the season-length version of this page's discipline
- One-Score Records Are Luck — the same statistical mistake made about teams instead of weeks
- NFL Scoring by Week — the calendar effect that is real, and how much smaller it is than it sounds
- Division Games and Home Field — the second candidate explanation, done properly
- Our Prediction Model, Fully Stated — the engine the replay imports
Go deeper
Want the code behind these metrics? Work through the 43-chapter NFL analytics tutorial.
Browse tutorials Free tools